BNBUSD Price Analysis – February 26
A breakdown at the $196 level by the bears may lead to the declination of the price to $142 level in which further decrease will drop the price to $117. The continuation of the bears defending the $196 support level may push up the price to the resistance level at $254; above the level is $311 and $364 resistance level.
BNB/USD Market
Key levels:
Supply levels: $254, $311, $364
Demand levels: $196, $142, $117
BNBUSD Long-term Trend: Bearish
The coin is conforming to a triangle chart pattern in the daily chart. February 19 was the first time the coin tested the resistance level at $364. The level rejected further increase in price with the formation of strong bearish candle. The price decline to $254 level. Today, February 26 the support level at $196 has been tested when the coin is pulling back from the resistance level at $254.
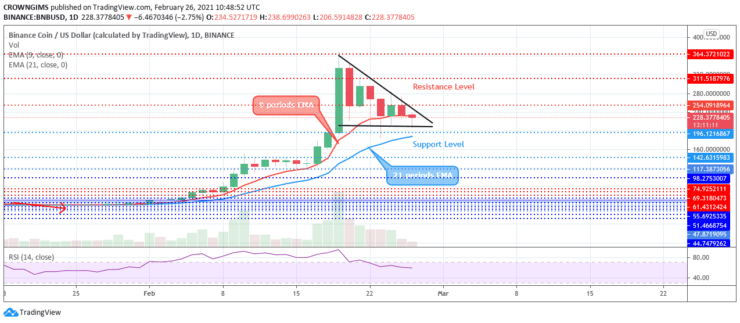
BNB is testing the support level at $196 as at the time of writing this report. A breakdown at the $196 level by the bears may lead to the declination of the price to $142 level in which further decrease will drop the price to $117. The continuation of the bears defending the $196 support level may push up the price to the resistance level at $254; above the level is $311 and $364 resistance level. The relative index indicator period 14 is at 60 levels with the signal line pointing down which connotes sell signal.
BNBUSD medium-term Trend: Bearish
BNB is bearish in the 4-hour chart. The price action has formed a triangle chart pattern in the 4-hour chart. Yesterday at the early market period, the price was in the ranging movement at $254 price level. The sellers later prevail and the price dropped towards the support level at $196. It seems the price may breakout at the lower trend line of the triangle which may leads to further price reduction.
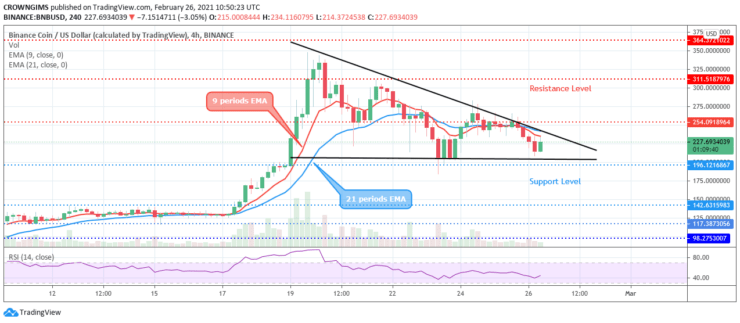
The price is awaiting a breakout from the triangle formed. The price is trading below the 9 periods EMA and 21 periods EMA. The relative strength index period 14 is exhibiting buy signal at 40 levels.
- Broker
- Min Deposit
- Score
- Visit Broker

- Award-winning Cryptocurrency trading platform
- $100 minimum deposit,
- FCA & Cysec regulated

- 20% welcome bonus of upto $10,000
- Minimum deposit $100
- Verify your account before the bonus is credited
- Fund Moneta Markets account with a minimum of $250
- Opt in using the form to claim your 50% deposit bonus
Learn to Trade
Never Miss A Trade Again

Signal Notification
Real-time signal notifications whenever a signal is opened, closes or Updated

Get Alerts
Immediate alerts to your email and mobile phone.

Entry Price Levels
Entry price level for every signal Just choose one of our Top Brokers in the list above to get all this free.