Ranging movement between $237.0 and $219.2 levels
BNBUSD Price Analysis: 08 December
Buyers holding the $219.2 support level have the potential to break the $237.0 resistance level, putting the $254.2 and $267.5 resistance levels in jeopardy. If $237.0 is not acceptable to both buyers and sellers. BNB may have closed at its most recent lows of $187.3 and $204.9, below the critical $219.2 barrier.
BNB/USD Market
Key levels:
Supply levels: $237.0, $254.2, $267.5
Demand levels: $219.2, $204.9, $187.3
BNBUSD Long-term Trend: Bearish
The daily BNBUSD chart is showing a downward trend. The cryptocurrency’s price ranged between $219.2 and $204.9 a few weeks ago. This range movement lasted for three weeks. $219.2, which had been a resistance level, became a support level as the bulls gained momentum. The BNB market was dominated by buyers last week. The amount increased to $267.5. Selling picked up steam on November 21, and the price crashed to retest $219.2. At the moment, buyers are gaining the upper hand in trying to break up the $237.0 level.
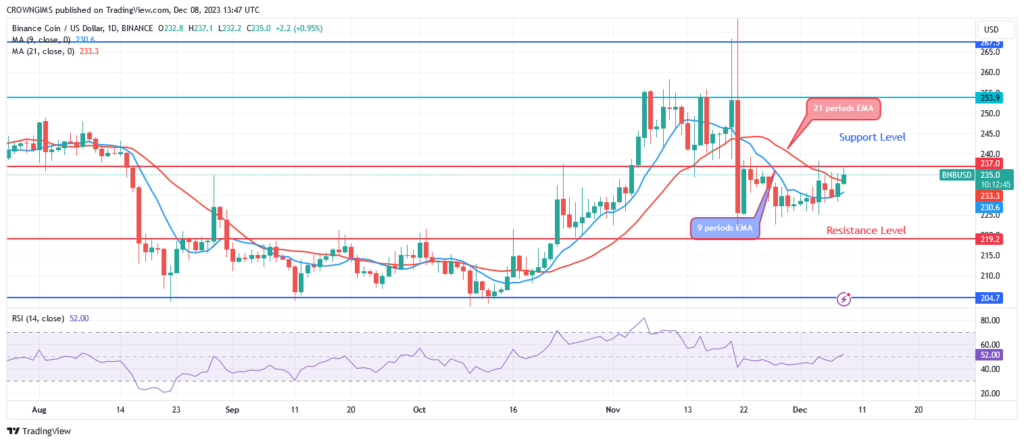
The cryptocurrency’s price is presently increasing and is slightly above the exponential moving averages with 9 and 21 periods. Buyers holding the $219.2 support level have the potential to break the $237.0 resistance level, putting the $254.2 and $267.5 resistance levels in jeopardy. If $237.0 is not acceptable to both buyers and sellers. BNB may have closed at its most recent lows of $187.3 and $204.9, below the critical $219.2 barrier.
BNBUSD medium-term Trend: Bearish
Over the following four hours, the trend might get better. The triple bottom pattern first observed on October 15 around the $204.9 support level, initiated a bullish trend. This led to an increase in the price. The $267.50 resistance level was looked at on November 21. The price fell to $219.2 when a strong bearish candle formed, signaling that sellers had had enough. The market is currently experiencing low volatility.
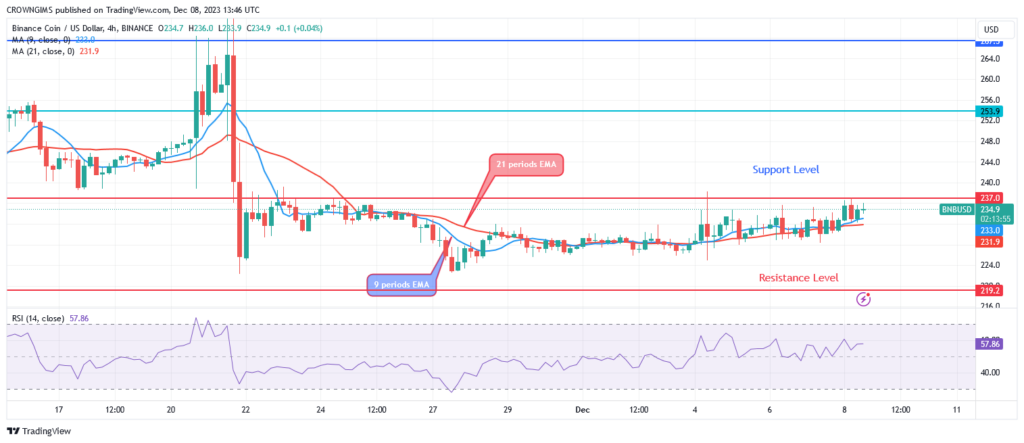
BNB is currently trading near the exponential moving averages with periods of 9 and 21. A buy is indicated by the relative strength index period 14 signal line’s upward increase at level 56.
You can purchase Lucky Block – Guide, Tips & Insights | Learn 2 Trade here. Buy LBLOCK
- Broker
- Min Deposit
- Score
- Visit Broker

- Award-winning Cryptocurrency trading platform
- $100 minimum deposit,
- FCA & Cysec regulated

- 20% welcome bonus of upto $10,000
- Minimum deposit $100
- Verify your account before the bonus is credited
- Fund Moneta Markets account with a minimum of $250
- Opt in using the form to claim your 50% deposit bonus
Learn to Trade
Never Miss A Trade Again

Signal Notification
Real-time signal notifications whenever a signal is opened, closes or Updated

Get Alerts
Immediate alerts to your email and mobile phone.

Entry Price Levels
Entry price level for every signal Just choose one of our Top Brokers in the list above to get all this free.