

Bitcoin SV Price Analysis – July 25
The price is bouncing off the $59 level. When the resistance level of $59 is defended by the bears, then, support levels of $41 and $35 may be tested Should the bulls’ pressure break up the resistance level of $59, $65 level may be broken upside and the resistance level of $71 may be tested.
Key Levels:
Resistance levels: $59, $65, $71
Support levels: $47, $41, $35
BSV/USD Long-term Trend: Ranging
On the daily chart, Bitcoin SV is on the ranging movement. The crypto has been range-bound within the resistance level of $59 and the support level of $47 since the beginning of July. The price tested the low of $47 support level and bounced up to test the resistance level of $59. The ranging movement continues until there is a breakout to the north or to the south. However, bears are dominating the market today.
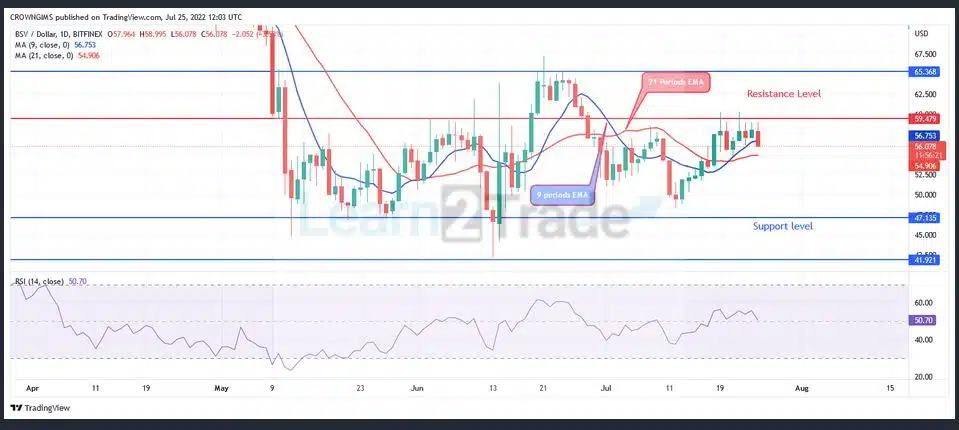
The crypto is trading between the 9 periods EMA and the 21 periods EMA with the daily bearish candle which indicate that sellers are ruling the market. The price is bouncing off the $59 level. When the resistance level of $59 is defended by the bears, then, support levels of $41 and $35 may be tested Should the bulls’ pressure break up the resistance level of $59, $65 level may be broken upside and the resistance level of $71 may be tested.
BSV/USD Medium-term Trend: Ranging
Bitcoin SV is on the ranging movement on the medium-term outlook. The price continues the movement within the $59 and $47 levels. Buyers’ momentum was interrupted when the price tested the resistance level of $59. The bears’ pressure increased and the price was pushed to the support level of $47. The price increase again and headed towards the previous resistance level of $59. At the moment, the price is repelling from the $59 level.

The price is trading below the 9 periods EMA and 21 periods EMA which indicate that bearish movement is in progress.
You can purchase Lucky Block here. Buy LBLOCK:


