Bitcoin SV Price Analysis – October 11
Further increase in the buyers’ momentum may breakup the resistance level at $193 level and increase the price to $233 and $266 price level. Inability to break up the $193 price level may lead to ranging market or a decrease in price towards the support levels of $147, $101 and $73.
Key Levels:
Resistance levels: $193, $233, $266
Support levels: $147, $101, $73
BSV/USD Long-term Trend: Bullish
On the daily chart, Bitcoin SV is bullish. The bears were controlling the Bitcoin SV market last two weeks. The sellers’ pressure failed at the support level of $101 and a bullish reversal candle pattern emerged called bullish engulfing. This triggered the upward movement of the coin. It increases and break up $148 level currently targeting the resistance level of $193.
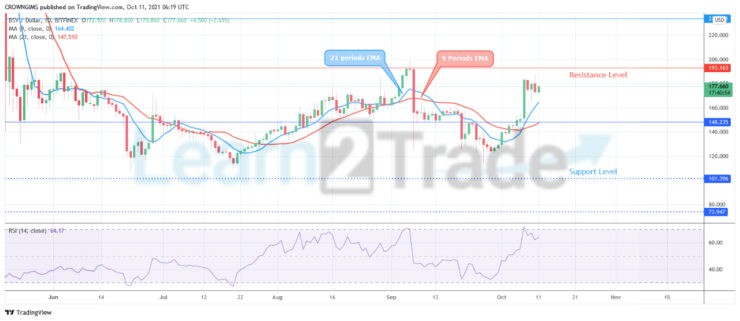
Bitcoin SV retain its trading above the 9 periods EMA and 21 periods EMA on the daily chart while the fast moving EMA remains above the slow moving EMA as a bullish movement indication. Further increase in the buyers’ momentum may breakup the resistance level at $193 level and increase the price to $233 and $266 price level. Inability to break up the $193 price level may lead to ranging market or a decrease in price towards the support levels of $147, $101 and $73. However, the Relative Strength Index (period 14) is above 60 levels with the signal line pointing up to indicate buy signal.
BSV/USD Medium-term Trend: Bullish
Bitcoin SV is bullish on the 4 hour chart. The Crypto tested the support level of $101 on September 26. The bulls defended the mentioned level and the price reversed. The bulls takes over the Bitcoin SV market and it increases towards the $190 resistance level. Throughout last week, the coin was under the control of the buyers. There is tendency for the price to continue increasing above the $190 level.
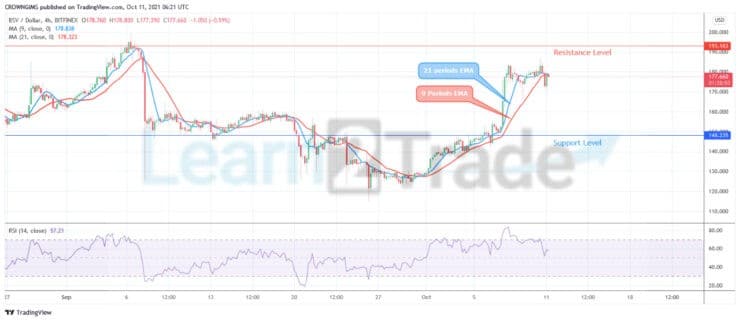
The two EMAs are close to each other and the price is trading around the 9 periods EMA and 21 periods EMA. The relative strength index period 14 is at 60 levels displaying buy signal.
You can purchase crypto coins here: Buy coins
- Broker
- Min Deposit
- Score
- Visit Broker

- Award-winning Cryptocurrency trading platform
- $100 minimum deposit,
- FCA & Cysec regulated

- 20% welcome bonus of upto $10,000
- Minimum deposit $100
- Verify your account before the bonus is credited
- Fund Moneta Markets account with a minimum of $250
- Opt in using the form to claim your 50% deposit bonus
Learn to Trade
Never Miss A Trade Again

Signal Notification
Real-time signal notifications whenever a signal is opened, closes or Updated

Get Alerts
Immediate alerts to your email and mobile phone.

Entry Price Levels
Entry price level for every signal Just choose one of our Top Brokers in the list above to get all this free.