Bitcoin SV Price Analysis – September 27
An increase in the sellers’ momentum may breakdown the support level at $101 level and reduce the price to $73 and $41 price level. Failure to break down the $101 price level may result to further increase in price towards the resistance levels of $141, $193 and $233.
Key Levels:
Resistance levels: $147, $193, $233
Support levels: $101, $73, $41
BSV/USD Long-term Trend: Bearish
On the daily chart, Bitcoin SV is bearish. The Bitcoin SV produced a chart pattern called evening star on the daily chart at the resistance level of $193. The crypto follows the direction of the bearish chart pattern. A massive daily bearish candle was produced which engulfs the previous candles. The support level of $143 was tested and broke down. It is currently declining towards the support level of $101.
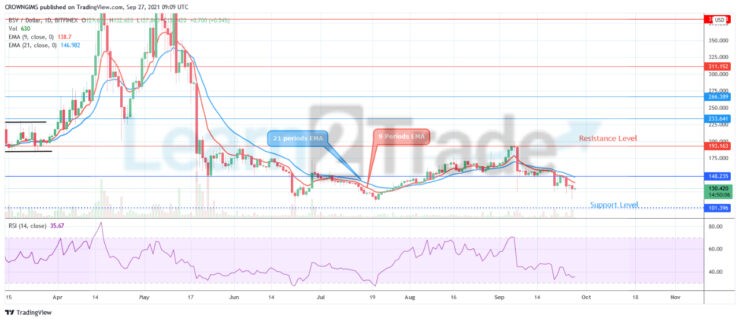
Bitcoin SV is trading below the 9 periods EMA and 21 periods EMA on the daily chart while the fast moving EMA remains below the slow moving EMA as a bearish movement indication. An increase in the sellers’ momentum may breakdown the support level at $101 level and reduce the price to $73 and $41 price level. Failure to break down the $101 price level may result to further increase in price towards the resistance levels of $141, $193 and $233. However, the Relative Strength Index (period 14) is below 40 levels with the signal line pointing down to indicate sell signal.
BSV/USD Medium-term Trend: Bearish
Bitcoin SV is bearish on the 4 hour chart. The Crypto broke out of consolidation movement that took place at $148 price level last week. When the resistance level of $193 was tested by the Bitcoin SV and bounces off the level. The sellers dominate the market and pushed the price down to the support level of $148. At the moment, the price is trading below the 4148 level heading towards the support level of $101.
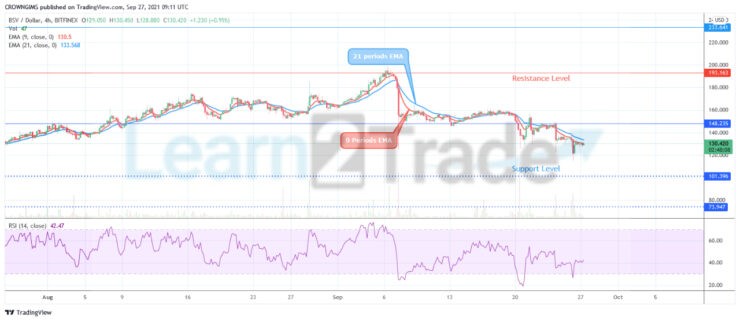
The two EMAs are separated from each other and the price is trading below the 9 periods EMA and 21 periods EMA. The relative strength index period 14 is at 40 levels displaying buy signal.
You can purchase crypto coins here: Buy coins
- Broker
- Min Deposit
- Score
- Visit Broker

- Award-winning Cryptocurrency trading platform
- $100 minimum deposit,
- FCA & Cysec regulated

- 20% welcome bonus of upto $10,000
- Minimum deposit $100
- Verify your account before the bonus is credited
- Fund Moneta Markets account with a minimum of $250
- Opt in using the form to claim your 50% deposit bonus
Learn to Trade
Never Miss A Trade Again

Signal Notification
Real-time signal notifications whenever a signal is opened, closes or Updated

Get Alerts
Immediate alerts to your email and mobile phone.

Entry Price Levels
Entry price level for every signal Just choose one of our Top Brokers in the list above to get all this free.