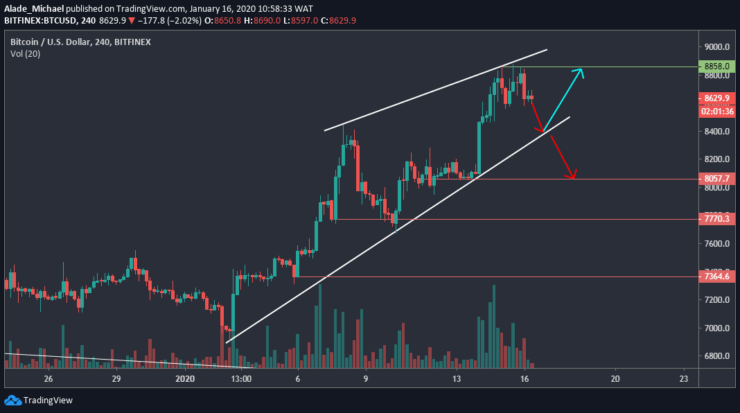
• The bullish pattern remains valid but could end if Bitcoin breaks down the wedge on the 4-hours chart.
After breaking $8400 two days ago, Bitcoin has been facing serious rejection around the $8800 resistance. Due to this, the BTC price dropped to $8600 support earlier today. If Bitcoin continues to correct, we may see a sell to $8000 and beyond before regaining momentum. However, a break above $8800 would confirm a more bullish setup.
Key resistance levels: $8700, $8850
Key support levels: $8400, $8000
Bitcoin (BTC) Price Analysis: 4H Chart – Bullish
On the 4-hours, Bitcoin’s price dropped to $8600 after witnessing a lot of rejection around the wedge’s resistance of $8800. The price could slip to the wedge’s support of $8400 in the next price drop. Nonetheless, BTC remains under a bullish control. So, there’s still hope for a rebound as the price may revisit $8700 and $8850 resistance levels.

The only thing to worry about here is a wedge breakdown. If this occurs, it might be the end of the short-term bullish as bears would step back into the market. The price ranges for a potential breakdown is $7770 and $7364. However, the $8000 is important support. If buyers reclaim $8850, Bitcoin would continue bullish impulsive.
Bitcoin (BTC) Price Analysis: 30M Chart – Neutral
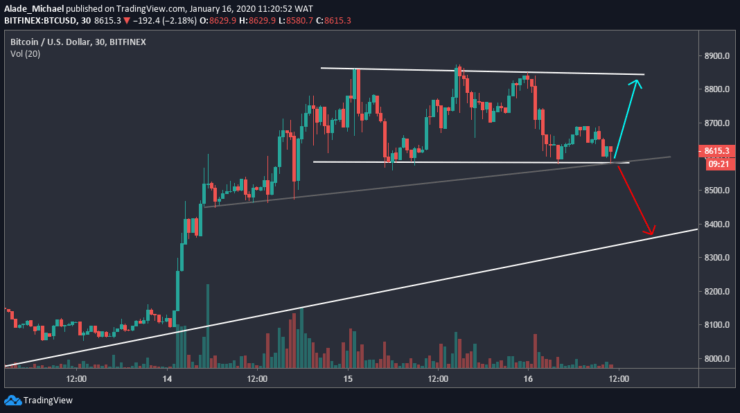
As of the time of writing, Bitcoin is trading at the bottom of the channel forming since yesterday. While sitting at this key support of $8600, two things are likely to happen: a make or break. If Bitcoin makes from this channel’s support, the price could head back the $8800 resistance to meet the channel’s upper boundary.

On the other hand, a breakdown could floor price in the $8400 support, testing the white rising trend line. Apart from the channel’s lower boundary, Bitcoin is also supported by a grey trend line that was formed since January 14. However, if BTC surges above the channel formation, we can expect more bullish setup. As of now, Bitcoin is moving sideways on the 30-minutes chart.
BITCOIN SELL SIGNAL
Sell Entry: $8615
TP: $8400
SL: $8712
- Broker
- Min Deposit
- Score
- Visit Broker
- Award-winning Cryptocurrency trading platform
- $100 minimum deposit,
- FCA & Cysec regulated
- 20% welcome bonus of upto $10,000
- Minimum deposit $100
- Verify your account before the bonus is credited
- Fund Moneta Markets account with a minimum of $250
- Opt in using the form to claim your 50% deposit bonus
Learn to Trade
Never Miss A Trade Again

Signal Notification
Real-time signal notifications whenever a signal is opened, closes or Updated

Get Alerts
Immediate alerts to your email and mobile phone.

Entry Price Levels
Entry price level for every signal Just choose one of our Top Brokers in the list above to get all this free.


