• A break below the weekly triangle might cause serious drops for Bitcoin on a long-term
After dropping sharply to $5600 yesterday, Bitcoin further dropped $1700 to reach $4000 (Bitfinex) mark earlier today. BTC market losses over 40% under 24-hour, that’s huge. This bearish sentiment has made BTC market capitalization dropped to $97.2 billion at the moment. If the global market continues to meltdown, we should expect cryptocurrency market to follow the course.
Key resistance levels: $6000, $6500
Key support levels: $5000, $4000
Bitcoin (BTC) Price Analysis: Weekly Chart – Bearish
As mentioned yesterday, Bitcoin dropped and wicked at $4000 a few hours ago after attempting to break below the weekly triangle. But Bitcoin quickly recovers back to where it’s currently trading around $5450 against the US Dollar. A clean rebound is likely if Bitcoin can remain within this symmetrical triangle.
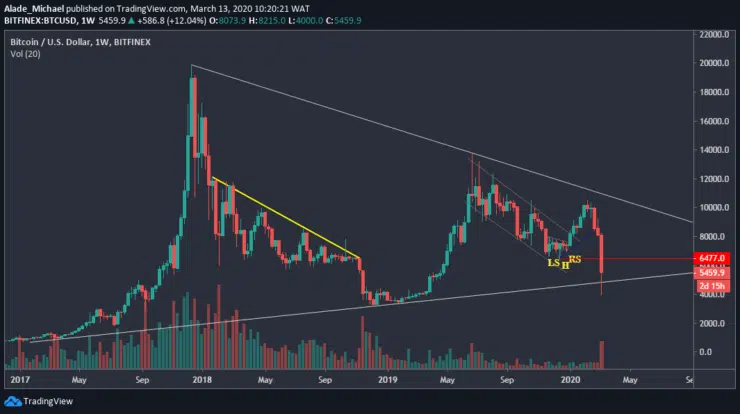
If the scenario occurs, the key resistances to consider here is the red line of $6500 – the mid-December low. If Bitcoin can reclaim this resistance, we may start to consider a short-term bullish. In case the bears resume pressure and wipe the $5000 level again, the price may roll back to the $4000 daily low or even beyond.
Bitcoin (BTC) Price Analysis: Daily Chart – Bearish
From $4000 low, Bitcoin recovered a quick $1400 following the huge selloff over the past hours. As of now, Bitcoin is trading above the $5000 level, which is an important level for the bulls. The buyers are showing interest in the market, but the bear interest appeared stronger on the daily chart.
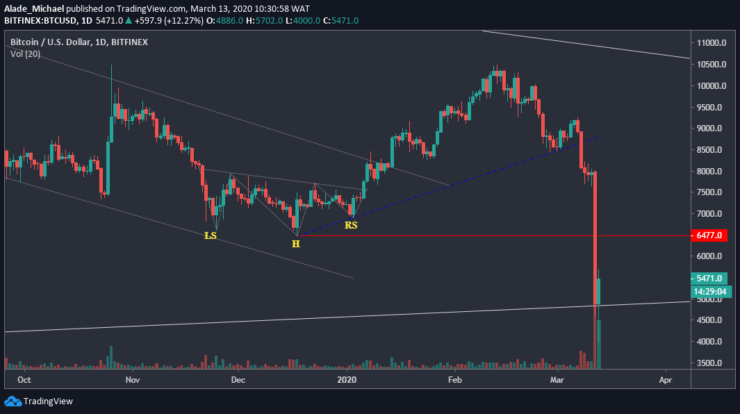
Technically, Bitcoin is trying to relieve the pressure with a nice pullback, which is likely to reach a psychological resistance level of $6000 and perhaps the $6500. A significant climb above this level could trigger more buy setup. Inversely, Bitcoin could drop lower if the price drops below $5000 and $4000. For the meantime, Bitcoin could remain under the bearish radar until buyers show stronger commitment.
BITCOIN PENDING ORDER
Sell: $6200
TP: $5000
SL: $6550
- Broker
- Min Deposit
- Score
- Visit Broker

- Award-winning Cryptocurrency trading platform
- $100 minimum deposit,
- FCA & Cysec regulated

- 20% welcome bonus of upto $10,000
- Minimum deposit $100
- Verify your account before the bonus is credited
- Fund Moneta Markets account with a minimum of $250
- Opt in using the form to claim your 50% deposit bonus
Learn to Trade
Never Miss A Trade Again

Signal Notification
Real-time signal notifications whenever a signal is opened, closes or Updated

Get Alerts
Immediate alerts to your email and mobile phone.

Entry Price Levels
Entry price level for every signal Just choose one of our Top Brokers in the list above to get all this free.