• The $8500 level remains a key support for Bitcoin
Over the past week now, Bitcoin continued to trade under the $9000 price level after recovery from a two-week low of $8450 (Bitfinex). Apart from that, the price has been consolidating between $8700 – $9000 areas for a while now. If Bitcoin moves out from this price range, we should expect a huge volatility expansion. Technically, the price is most likely to go up.
Key resistance levels: $9200, $9500
Key support levels: $8700, $8500
Bitcoin (BTC) Price Analysis: 4H – Bullish
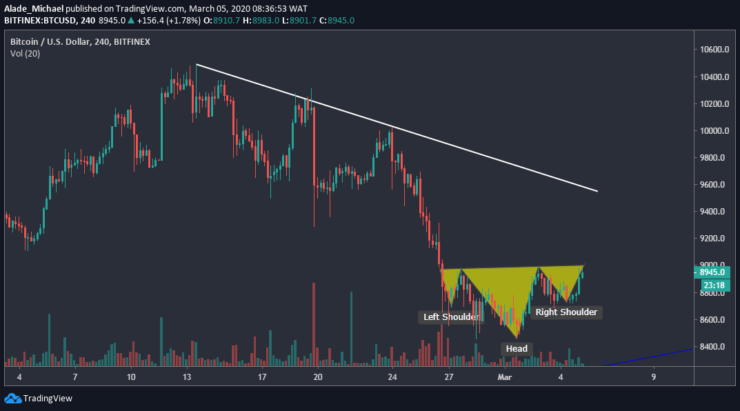
Again, Bitcoin has faced a tough resistance that has held buying pressure for the past few days now. Meanwhile, the bullish head-and-shoulders pattern is still valid on the 4-hours. In fact, Bitcoin is charging for a break at the neckline ($9000 resistance). Though, the price is currently rejected.

If this resistance breaks, Bitcoin is expected to hit $9200 resistance in no time. The next resistance above this is $9500 to test the white descending line. A break above this line would signify a bullish confirmation. But if the price continues to reject at $9000, Bitcoin is likely to fall back at $8700 support. $8500 would be next if price further plunges.
Bitcoin (BTC) Price Analysis: Hourly Chart – Bullish
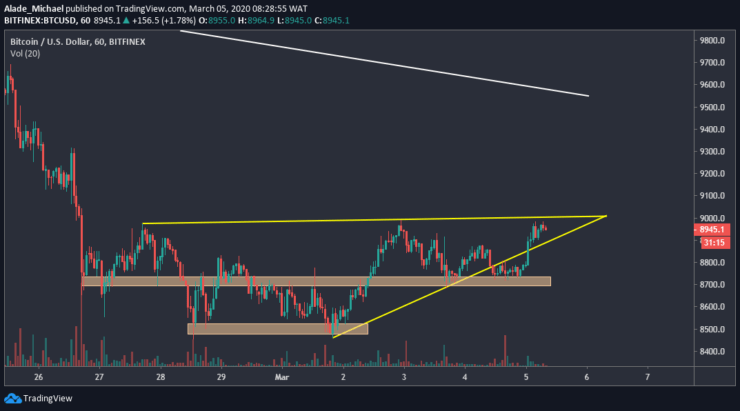
Yesterday, Bitcoin made a false break below the rising triangle that was spotted on the hourly chart. However, the price bounced back after finding close support at $8700, marked orange on the chart. Following this rebound, Bitcoin has now reached a tight range on the triangle. This suggests a potential breakout in the air.

Typically, a bullish surge is most likely to play out. The price range for this triangle breakout is $9500. But the first resistance to consider here is $9200, followed by $9300. In case the price goes the other way round, the primary support is the recent bounced back level of $8700. Below this lies the late February low of $8500. Regardless of the above, there’s a high probability for bullish than bearish.
BITCOIN BUY ORDER
Buy: $8912
TP: $9200
SL: $8688
- Broker
- Min Deposit
- Score
- Visit Broker
- Award-winning Cryptocurrency trading platform
- $100 minimum deposit,
- FCA & Cysec regulated
- 20% welcome bonus of upto $10,000
- Minimum deposit $100
- Verify your account before the bonus is credited
- Fund Moneta Markets account with a minimum of $250
- Opt in using the form to claim your 50% deposit bonus
Learn to Trade
Never Miss A Trade Again

Signal Notification
Real-time signal notifications whenever a signal is opened, closes or Updated

Get Alerts
Immediate alerts to your email and mobile phone.

Entry Price Levels
Entry price level for every signal Just choose one of our Top Brokers in the list above to get all this free.


