• Bitcoin is down by 2.30% following a price rejection at $5500
• Bitcoin remains in a tight range, but a triangle breakout is likely on the hourly
Since our previous crypto trading signals, Bitcoin continued to facing tough resistance around $5560. More so, the market is in a range-bound for the past few days now, which shows that supply and demand are at equilibrium. Bitcoin is expected to start a fresh rally as soon as price breaks out from this range. As of now, BTC is trading around $5200.
Key resistance levels: $5500, $6000
Key support levels: $5000, $4465
Bitcoin (BTC) Price Analysis: 4H Chart – Neutral
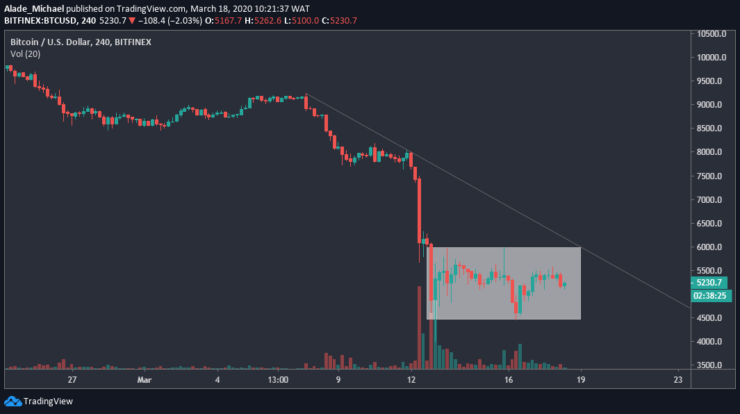
Following the latest price actions, Bitcoin is still looking neutral-bearish on the 4-hour time frame. The price is currently consolidating in a tight area of $4500 – $6000, which is marked on the price chart. Considering the grey regression line, we can say Bitcoin is still under bearish control.

As we can see now, the price is slowly dropping towards psychological support of $5000.
If Bitcoin drops beneath this support, the next support to watch out for is $4465, which is the weekly low and at the same time a breakout for the bears. However, if the buyers can overcome the previous resistance of $5500, we can expect the market to reach $6000 (a breakout for the bulls).
Bitcoin (BTC) Price Analysis: Hourly Chart – Neutral
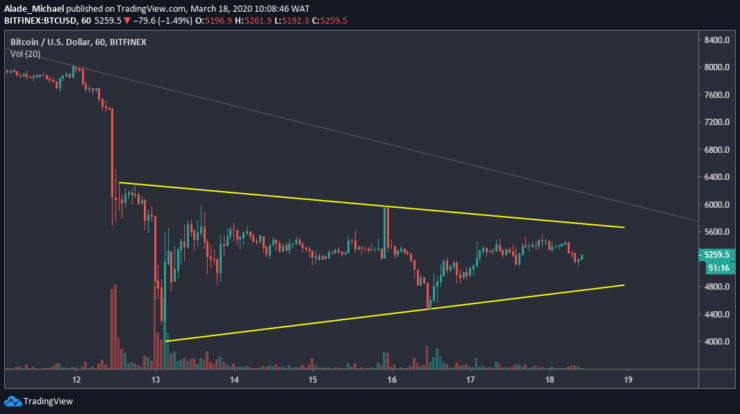
Over the past days, Bitcoin’s volatility is contracting in a symmetrical triangle. As we can see, the price is approaching a tight area on the triangle, which could lead to a price explosion soon. Meanwhile, Bitcoin has seen a mild gain since the market opens for the week. As it appeared now, the price is likely to fade away.

If Bitcoin continued to show strength and breaks above this triangle, the immediate resistance to keep an eye on is the $6000 level – the weekly high. Above this resistance lies the $6400. On the downside, there’s minor support at $4800, right on the lower boundary of the triangle. A break beneath this triangle might return Bitcoin to the old support of $4465 and $4000 (last week’s low). Currently, Bitcoin remains neutral on the hourly chart.
BITCOIN SELL ORDER
Sell: $5200
TP: $5077
SL: $5600
- Broker
- Min Deposit
- Score
- Visit Broker
- Award-winning Cryptocurrency trading platform
- $100 minimum deposit,
- FCA & Cysec regulated
- 20% welcome bonus of upto $10,000
- Minimum deposit $100
- Verify your account before the bonus is credited
- Fund Moneta Markets account with a minimum of $250
- Opt in using the form to claim your 50% deposit bonus
Learn to Trade
Never Miss A Trade Again

Signal Notification
Real-time signal notifications whenever a signal is opened, closes or Updated

Get Alerts
Immediate alerts to your email and mobile phone.

Entry Price Levels
Entry price level for every signal Just choose one of our Top Brokers in the list above to get all this free.


