• Short-term bullish remains valid but Bitcoin may correct slightly down before rally continues.
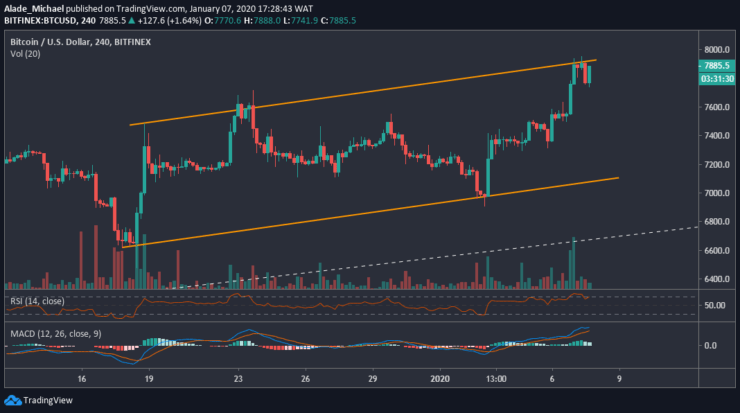
Bitcoin continues to follow a bullish sentiment after breaking out of a critical resistance of $7800 yesterday. BTC has recorded a 24-hour high of $7860 on Bitfinex. If the price further shoots above $8000, Bitcoin might just be starting a medium-term bullish rally. However, we should expect a retracement move if Bitcoin respects the channel pattern forming on the 4-hour chart.
Key resistance levels: $8000, $8300
Key support levels: $7600, $7300
Bitcoin (BTC) Price Analysis: 4H Chart – Bullish
From a weekly opening of $7000, Bitcoin has seen a substantial increase to $7960 today. At the same time, the price has reached the channel’s upper boundary – this suggests the price may soon roll back the bottom of the channel. The key support for such a move is $7600 and $7300.

We can see that Bitcoin has reached a turning point on the technical RSI indicator, although the MACD is still shooting high. However, if the buyers manage to extend their stay in the market, the price of Bitcoin may hit $8000 within a blink. A cross above the mentioned price could propel buying to $8300, breaking above the channel formation. Above all, BTC remains under bullish control for now.
Bitcoin (BTC) Price Analysis: 30M Chart – Bullish
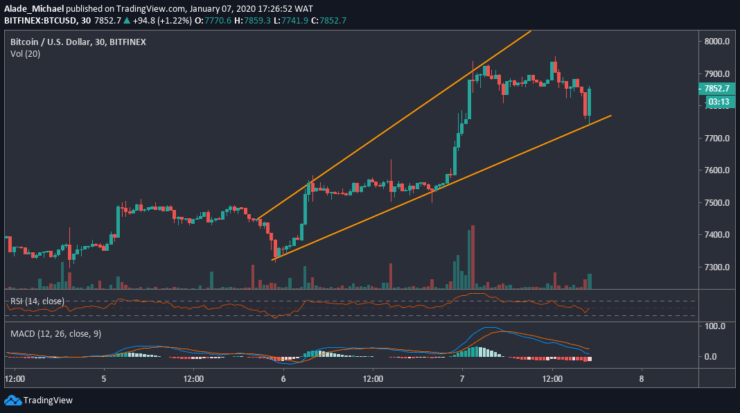
Bitcoin is currently forming in a rising broadening wedge on the 30M time frame. After reaching $7860 today, the market fell to the wedge’s support of $7750 before bouncing back to $7852 – where BTC is now priced at. If the mentioned support continues to hold, we may see a sharp gain to $8000 before deciding on the next move.

Meanwhile, the technical indicators are still in a downward range. In fact, the RSI has dropped below the 50 level as the MACD faces the zero level. If Bitcoin continues to show weakness on the technical indicators, the price may fall back to the current holding support of $7750. A drive beneath the wedge may cause a serious selloff in the market.
BITCOIN BUY SIGNAL
Buy Entry: $7750
TP: $7997
SL: $7694
- Broker
- Min Deposit
- Score
- Visit Broker
- Award-winning Cryptocurrency trading platform
- $100 minimum deposit,
- FCA & Cysec regulated
- 20% welcome bonus of upto $10,000
- Minimum deposit $100
- Verify your account before the bonus is credited
- Fund Moneta Markets account with a minimum of $250
- Opt in using the form to claim your 50% deposit bonus
Learn to Trade
Never Miss A Trade Again

Signal Notification
Real-time signal notifications whenever a signal is opened, closes or Updated

Get Alerts
Immediate alerts to your email and mobile phone.

Entry Price Levels
Entry price level for every signal Just choose one of our Top Brokers in the list above to get all this free.


