Key Support Zones: $7, 000, $6, 000, $5,000
BTC/USD Long-term Trend: Bullish
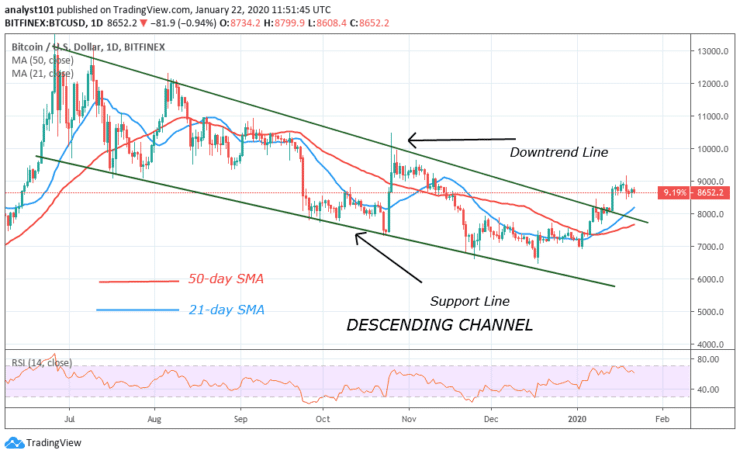
Bitcoin is in a stalemate as the bulls failed to break above $9,200 resistance level on January 19. For the coin to avoid a breakdown, Bitcoin has to stay above $9,200 or $10,000 price level. Previous price action has shown that Bitcoin failed to move upward as buying dries up at a higher price level. Presently, BTC is ranging above the support zone.
On the upside, if price rises, the bulls will intend to retest the $9,200 resistance. If successful, Bitcoin will attain the $10,300 mark and avoid a price breakdown. On the contrary, if the bulls fail to rally above $9,000, the current support may be broken. The price may drop to a low of $7,800 and further selling may ensue.

Daily Chart Indicators Reading:
Bitcoin in the meantime is trading above zero lines of MACD. That is, when the MACD line and the signal line are above the zero lines, it is a buy signal for the coin. Meanwhile, the 12-day SMA provides strong support for Bitcoin.
BTC/USD Medium-term bias: Bullish
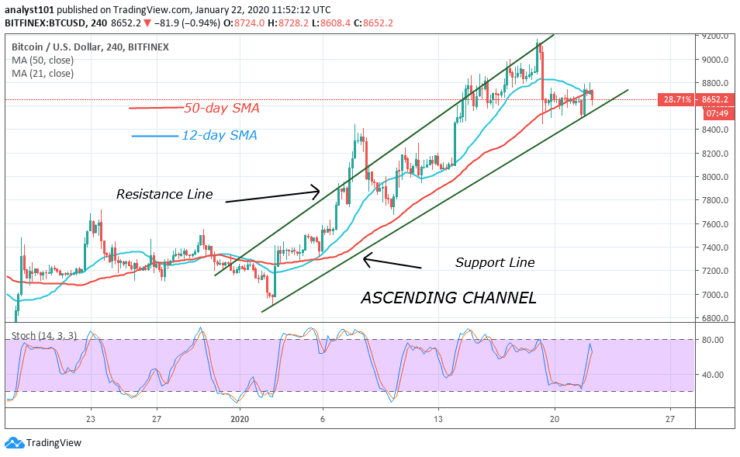
On the 4 –hour chart, Bitcoin is ranging above $8,600 for the past four days. The price action is characterized by small body indecisive candlesticks like the Doji and Spinning tops. At the moment the coin is falling. BTC will fall if the current support is broken by the bears.

4-hour Chart Indicators Reading
Presently, Bitcoin is in a bearish momentum as the stochastic bands make a U-turn below the 80% range. The moving averages are on the verge of a bearish crossover. Presently, the EMAs have been broken by the bear candle. Nevertheless, the selling pressure may resume if the bears break the support line of the ascending channel.
General Outlook for Bitcoin (BTC)
It is becoming clear that the bears will take control of the price if the bulls fail to break the $9,200 resistance level. Some of the indicators are indicating partial bearish signals. The support above $8,600 has been relatively stable for Bitcoin for the past four days. The small body candlesticks on the chart describe the indecision between the buyers and sellers about the direction of the market.
BTC Trade Signal
Instrument: BTC/USD
Order: Sell
Entry price: $8,600
Stop: $8,800
Target: $8,000
Note: Learn2Trade.com is not a financial advisor. Do your research before investing your funds in any financial asset or presented product or event. We are not responsible for your investing results
- Broker
- Min Deposit
- Score
- Visit Broker
- Award-winning Cryptocurrency trading platform
- $100 minimum deposit,
- FCA & Cysec regulated
- 20% welcome bonus of upto $10,000
- Minimum deposit $100
- Verify your account before the bonus is credited
- Fund Moneta Markets account with a minimum of $250
- Opt in using the form to claim your 50% deposit bonus
Learn to Trade
Never Miss A Trade Again

Signal Notification
Real-time signal notifications whenever a signal is opened, closes or Updated

Get Alerts
Immediate alerts to your email and mobile phone.

Entry Price Levels
Entry price level for every signal Just choose one of our Top Brokers in the list above to get all this free.


