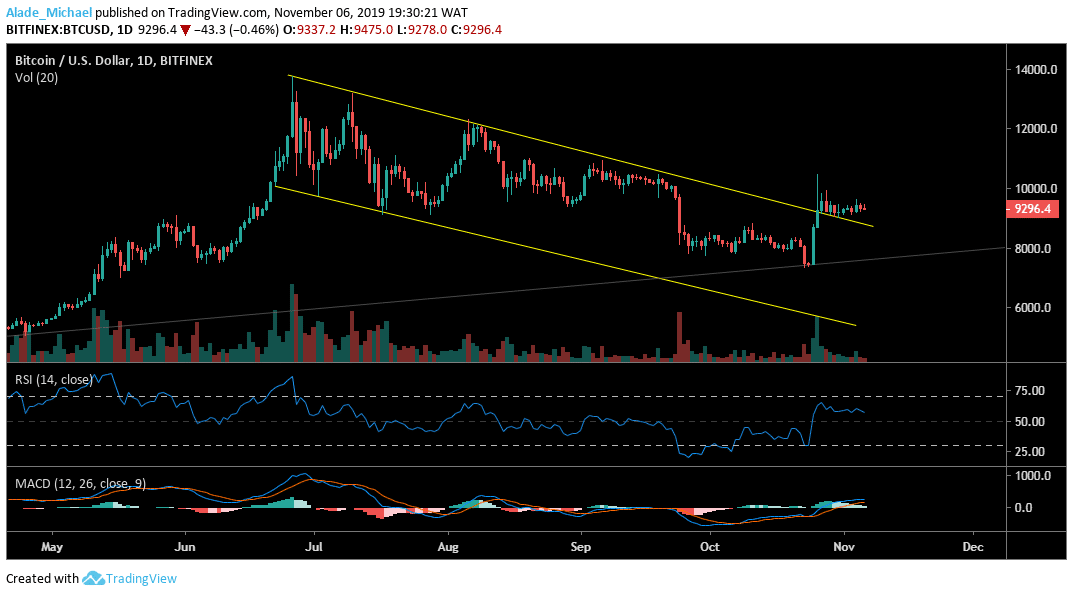
Bitcoin (BTC) Price Analysis: Daily Chart – Bullish
Key resistance levels: $9600, $9800, $10000
Key support levels: $9200, $9000, $8820
Above the $9000, Bitcoin is still looking bullish on the daily chart but last 10 days indecisiveness has suspended the bullish actions. For the past 24-hours, BTC has been finding it difficult to continue the late October surge which has stuck price actions at an average of $9200. Bitcoin’s breakout still remains at $9500, followed by $9800 and $10000 resistance.

In the opposite direction, Bitcoin currently held support at $9000 and $8800 but the $9200 support remains solid. The technical indicators have seen a little drop due to the ongoing bearishness in the market. We can expect a rebound if the $9000 support can hold.
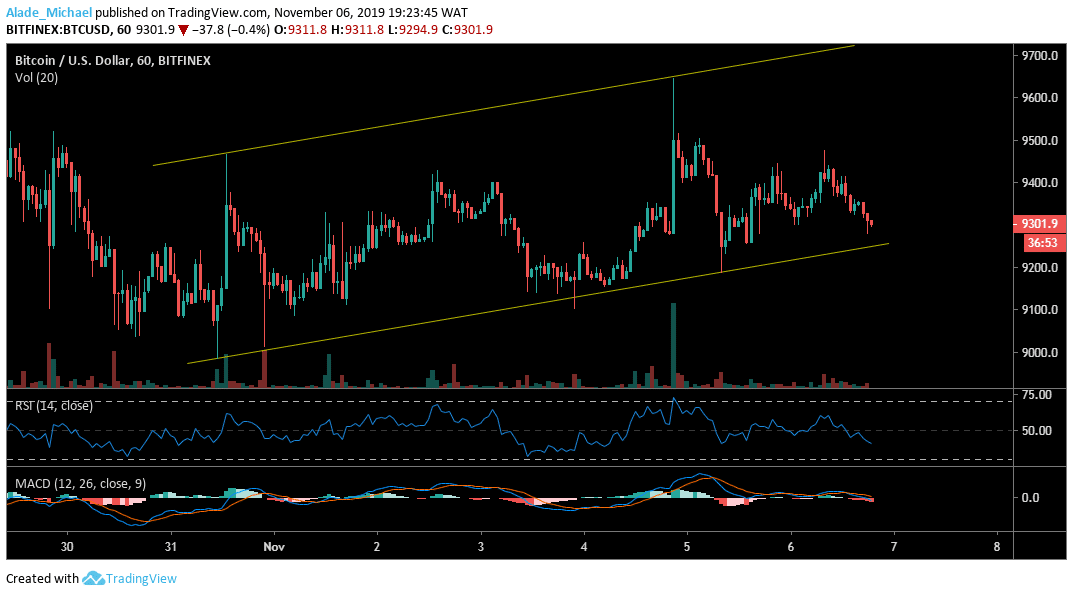
Bitcoin (BTC) Price Analysis: Hourly Chart – Bullish
Bitcoin’s price has remained intact in the rising channel for the past week now. But now, the market has been trading sideways around the channel’s lower boundary since yesterday due to capitulation. Following the pattern formation, Bitcoin is expected to climb towards the upper boundary but volatility is contracting for a while now.

If volatility expansion occurs, on the upside, BTC may spike to $9400, $9500, $9600 and $9700. On the downside, the $9100, $9000, $8900 and $8800 support may hold further selling pressure. As shown on the RSI, Bitcoin is currently looking bearish as the MACD shows that the bears are in play but the market is still in a bullish zone
BITCOIN BUY SIGNAL
Buy Entry: $9279
TP: $9551 / $9400
SL: $9200
- Broker
- Min Deposit
- Score
- Visit Broker
- Award-winning Cryptocurrency trading platform
- $100 minimum deposit,
- FCA & Cysec regulated
- 20% welcome bonus of upto $10,000
- Minimum deposit $100
- Verify your account before the bonus is credited
- Fund Moneta Markets account with a minimum of $250
- Opt in using the form to claim your 50% deposit bonus
Learn to Trade
Never Miss A Trade Again

Signal Notification
Real-time signal notifications whenever a signal is opened, closes or Updated

Get Alerts
Immediate alerts to your email and mobile phone.

Entry Price Levels
Entry price level for every signal Just choose one of our Top Brokers in the list above to get all this free.


