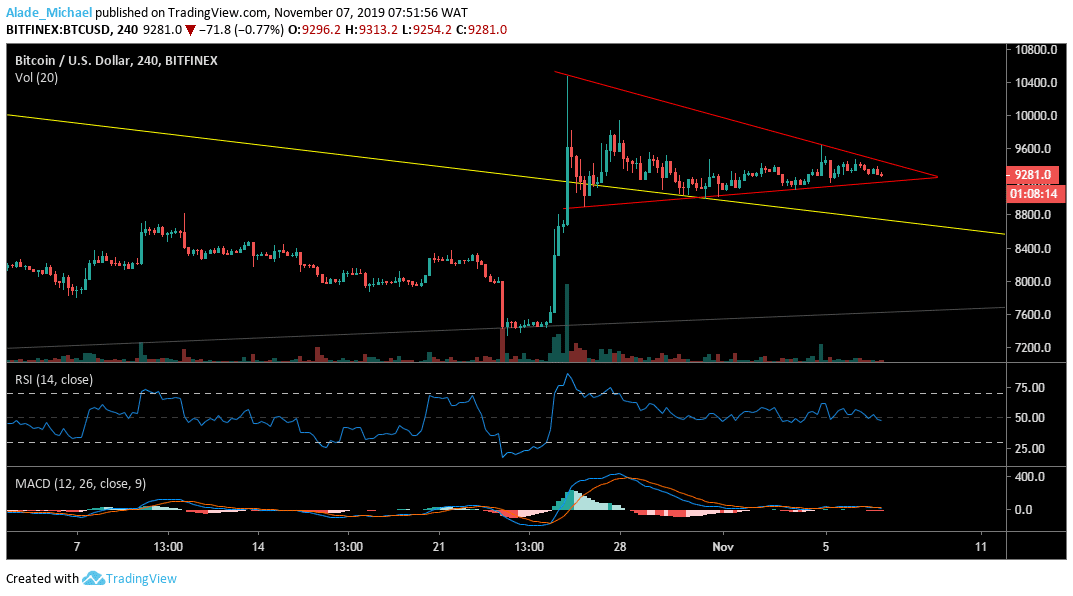
Bitcoin (BTC) Price Analysis: 4H Chart – Neutral
Key resistance levels: $9600, $9800, $10000
Key support levels: $9200, $9000, $8820
Even though Bitcoin appeared indecisive on the 4-hour time frame but there’s a high probability of making a bullish move. If we look at the technical indicators reading, Bitcoin is managing to stay positive despite the recent price cut to $9200. This trading zone has been supporting the market for a while now.

If the mentioned support could no longer hold, BTC may short support to $9000 followed by $8820. However, a bounce could allow the market to test the $9500 resistance again. Above this resistance lies the $9800 and $10000. It’s important to note that Bitcoin is now forming a triangle pattern as a surge in volatility is imminent.
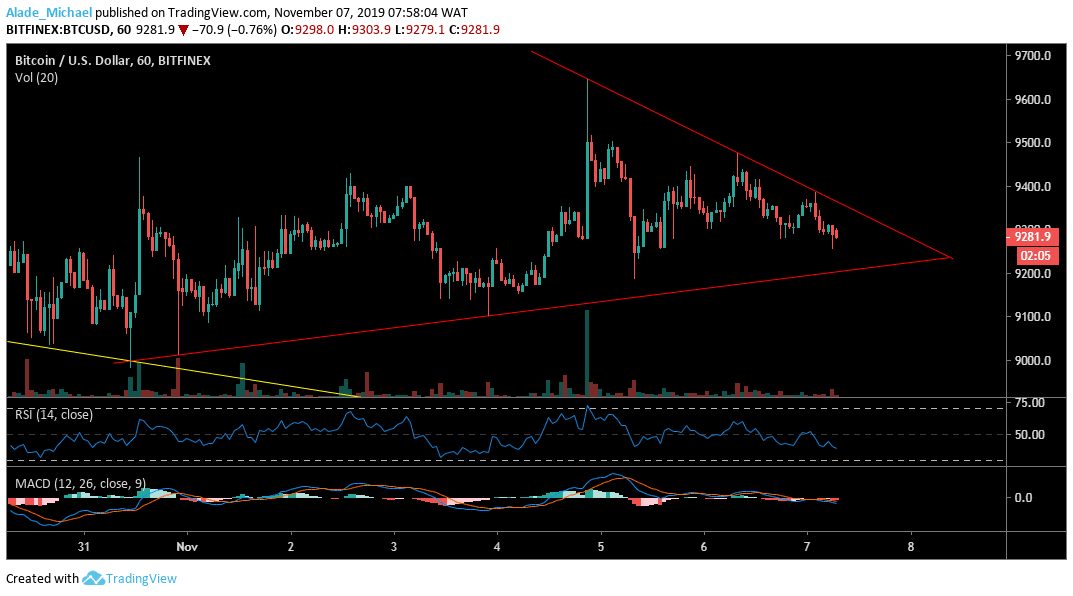
Bitcoin (BTC) Price Analysis: Hourly Chart – Neutral
From the hourly outlook, Bitcoin is moving sideways with price bars spotted in a symmetrical triangle – which might cause a significant price surge soon. We can see that the last 24-hours trading has been in favour of the bear while a neutral trend plays. If the bears drive the price below the triangle formation, Bitcoin may find the nearest bottom at $9100 and $9000.

The MACD and RSI are currently showing a sign of weakness due to the latest price drops. Should a positive move occurs, BTC could surge to $9400, $9500 and $9600 above the triangle. Nevertheless, the leading cryptocurrency is still struggling to move out of a controversial price area.
BITCOIN BUY SIGNAL
Buy Entry: $9271
TP: $9551 / $9591
SL: $9100
- Broker
- Min Deposit
- Score
- Visit Broker
- Award-winning Cryptocurrency trading platform
- $100 minimum deposit,
- FCA & Cysec regulated
- 20% welcome bonus of upto $10,000
- Minimum deposit $100
- Verify your account before the bonus is credited
- Fund Moneta Markets account with a minimum of $250
- Opt in using the form to claim your 50% deposit bonus
Learn to Trade
Never Miss A Trade Again

Signal Notification
Real-time signal notifications whenever a signal is opened, closes or Updated

Get Alerts
Immediate alerts to your email and mobile phone.

Entry Price Levels
Entry price level for every signal Just choose one of our Top Brokers in the list above to get all this free.


