Bitcoin (BTC) Price Analysis: Hourly Chart – Neutral
Key resistance levels: $7400, $7600, $7800
Key support levels: $7200, $7000, $6800
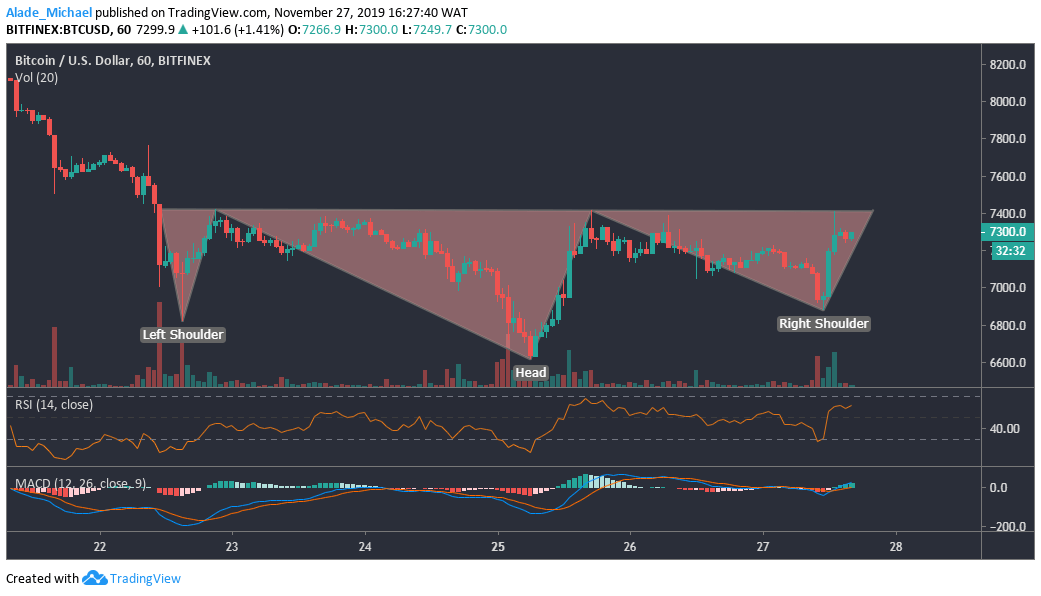
Bitcoin is almost completing an inverse head-and-shoulder pattern on the hourly chart. This pattern is a bullish formation that could play out any time from now. This time, the $7400 resistance that has been holding Bitcoin for about two days could become support. However, a breakout could propel BTC price to $7600 and $7800 within a blink of an eye.

After recovering sharply from a new daily low of $6880, Bitcoin has now moved immediate support to $7200, followed by $7000. Due to the latest price increase, Bitcoin is now trading above the RSI bullish zone after sitting mounting support on the 30 level. Though, the MACD is yet to make a clear bullish signal. A climb back above the immediate resistance should confirm a short-term bullish run for Bitcoin. However, BTC is indecisive amidst a bearish trend.
Bitcoin (BTC) Price Analysis: 15M Chart – Bullish
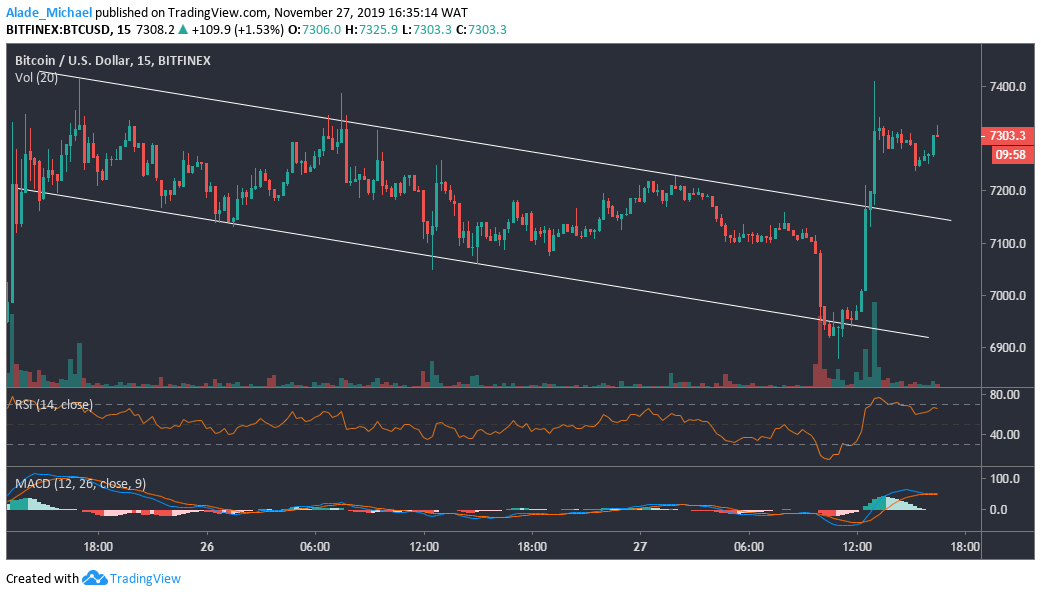
Looking at the bigger picture, Bitcoin’s trading has moved out of the descending channel forming on the 15-minutes time frame since yesterday, following a sudden price increase during the London session today. A close look at the price chart suggests a bullish formation for Bitcoin. Touching $7409 on the day, the next buying target lies at $7500 and $7600 resistance.

Meanwhile, the recent surge has led Bitcoin to the overbought zone on the RSI indicator, now attempting to fall back. Gauging the MACD, Bitcoin has entered a positive zone but poised for a minor downward correction which could cause the price to pull back to $7200 before rising back. Testing $7100 and $7000 support could allow BTC trade back inside the channel pattern. As of now, a bullish setup is forming for Bitcoin on the short-term perspective.
BITCOIN SELL SIGNAL
Sell Entry: $7300
TP: $7177
SL: 7421
- Broker
- Min Deposit
- Score
- Visit Broker
- Award-winning Cryptocurrency trading platform
- $100 minimum deposit,
- FCA & Cysec regulated
- 20% welcome bonus of upto $10,000
- Minimum deposit $100
- Verify your account before the bonus is credited
- Fund Moneta Markets account with a minimum of $250
- Opt in using the form to claim your 50% deposit bonus
Learn to Trade
Never Miss A Trade Again

Signal Notification
Real-time signal notifications whenever a signal is opened, closes or Updated

Get Alerts
Immediate alerts to your email and mobile phone.

Entry Price Levels
Entry price level for every signal Just choose one of our Top Brokers in the list above to get all this free.


