Bitcoin (BTC) Price Analysis: Daily Chart – Bearish
Key resistance levels: $7300, $7500
Key support levels: $6800, $6400
The bearish impulsive is yet to finish if we consider the descending channel pattern on the daily chart – which suggests that there’s more space to accommodate the suspended selling pressure in the market. The bearish target lies at the bottom of the channel at $6400 – a possible bullish bounce for the market. Moreover, Bitcoin is currently sitting on the $6800 support.
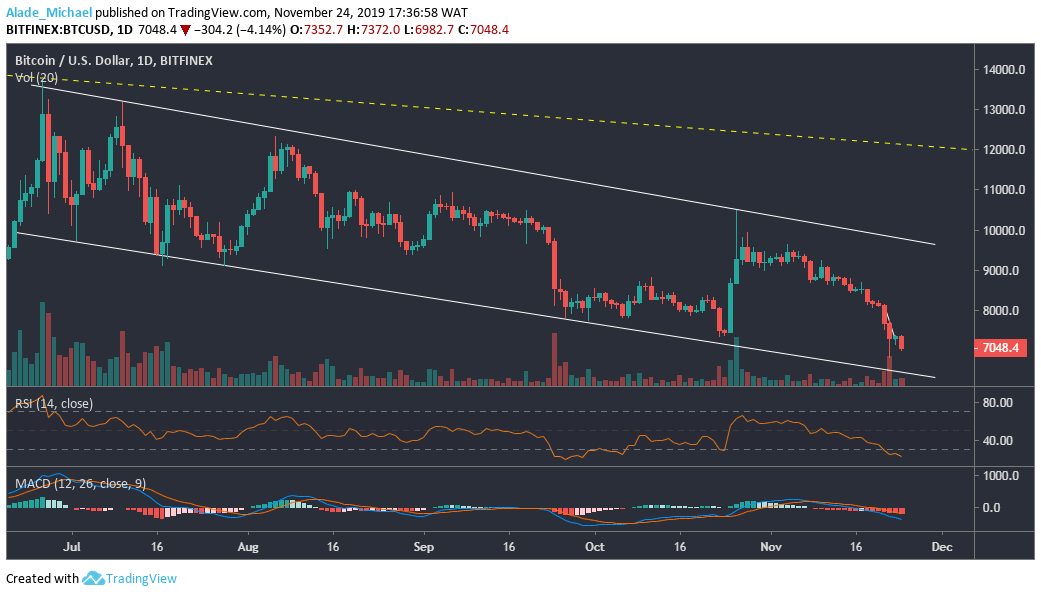
We can see that the last four weeks of price drops has recently led the RSI indicator in the oversold territories to show that the sellers are really gaining dominance. Additionally, the MACD ha crossed back to the negative zones, indicating a strong bearish control. For a retracement, Bitcoin held resistance level at $7300 and $7500 at the moment.
Bitcoin (BTC) Price Analysis: Hourly Chart – Bearish
Bitcoin has continued to show a sign of weakness on the hourly chart. While building a bearish formation, the market is likely to witness another devastating drop which could slip the price of BTC to $6800 support in no time. The sellers are resuming back in the market. This time, the scenario could get uglier if the market breaks below the $7000 support.
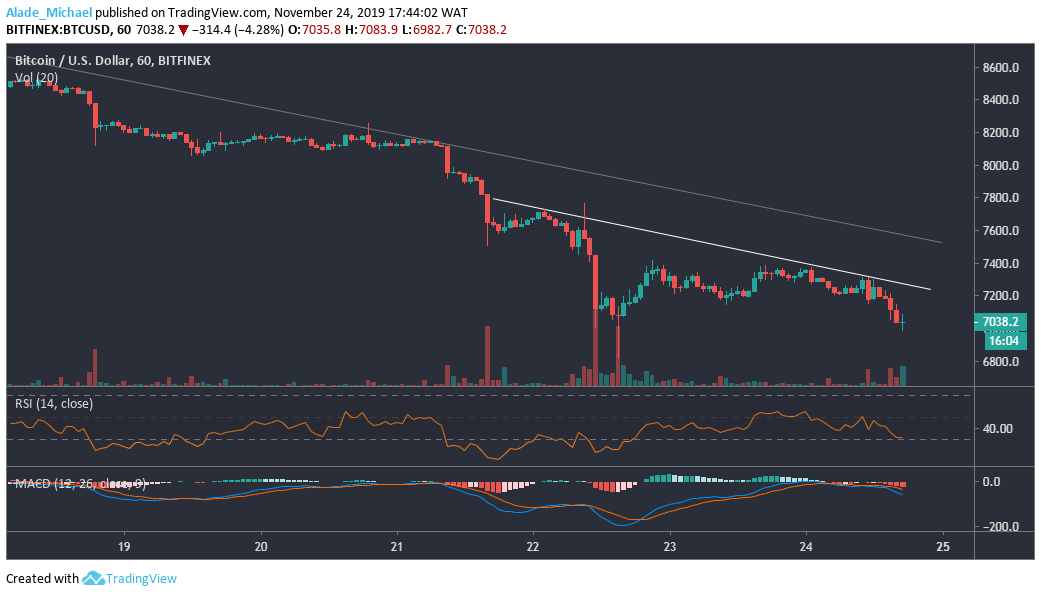
Though, Bitcoin has currently found support on the RSI 30 level. A bounce could push the market a bit to the white diagonal resistance line at $7200 before dropping back. A further rise could allow BTC to test the $7370 and $7500, which is a bullish break level for the market. The recent rejection on the MACD indicator may cause a more selling pressure in the market. But now, BTC volatility remains low.
BITCOIN SELL SIGNAL
Sell Entry: $7251
TP: $6800 / $6400
SL: 7451
- Broker
- Min Deposit
- Score
- Visit Broker

- Award-winning Cryptocurrency trading platform
- $100 minimum deposit,
- FCA & Cysec regulated

- 20% welcome bonus of upto $10,000
- Minimum deposit $100
- Verify your account before the bonus is credited
- Fund Moneta Markets account with a minimum of $250
- Opt in using the form to claim your 50% deposit bonus
Learn to Trade
Never Miss A Trade Again

Signal Notification
Real-time signal notifications whenever a signal is opened, closes or Updated

Get Alerts
Immediate alerts to your email and mobile phone.

Entry Price Levels
Entry price level for every signal Just choose one of our Top Brokers in the list above to get all this free.