Bitcoin (BTC) Price Analysis: Daily Chart – Neutral
Key resistance levels: $9600, $9800, $10000, $10350
Key support levels: $9200, $9000, $8820, $8500
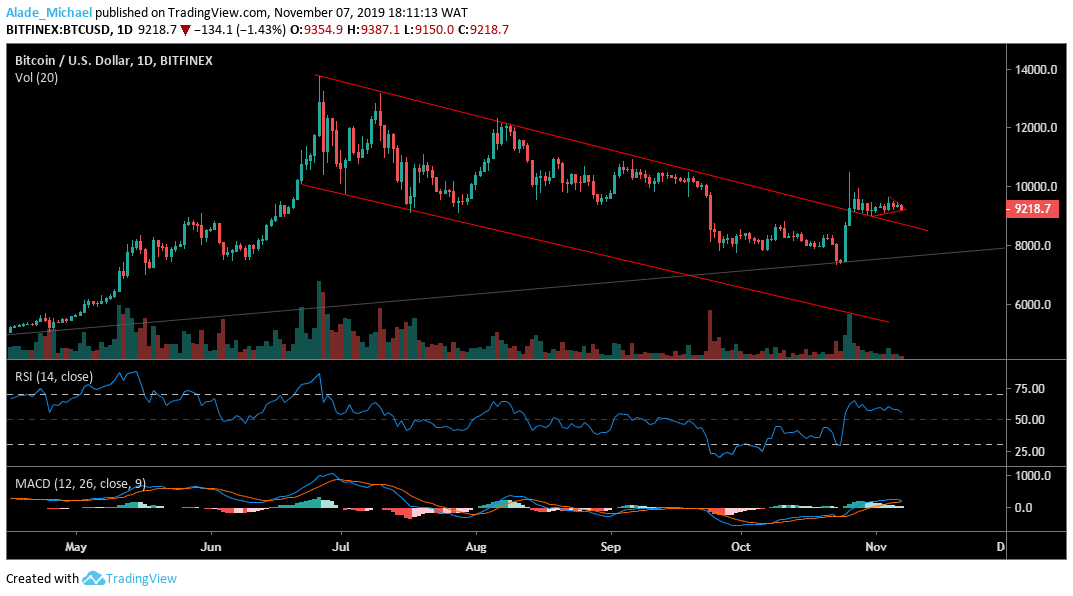
On the daily chart, Bitcoin is following a sideways movement for the past 11 days now. The October 26 price cut at $10350 has made the BTC market to subdue with choppy price actions. Meanwhile, the insignificant volatility is making the trade to stay quiet and calm for a while.

While waiting, Bitcoin’s bullish are still defending the $9000-$8900 support zone, although the market has shown a bearish sign over the past three days now. If the market can stay above the descending channel, Bitcoin may activate a bullish mode to $9800, $10000 and $10350 resistance before testing further resistance. On the downside, a break beneath the $9000 may lead BTC to $8800 and possibly $8500 support.
We can see that the MACD has produced a bullish crossover to show that an incoming bullish momentum. However, the BTC/USD pair is locating support on the RSI mid-band. If the RSI 50 can hold well, we should expect a significant bullish surge to $12000 within a blink of an eye.
Bitcoin (BTC) Price Analysis: Hourly Chart – Bearish
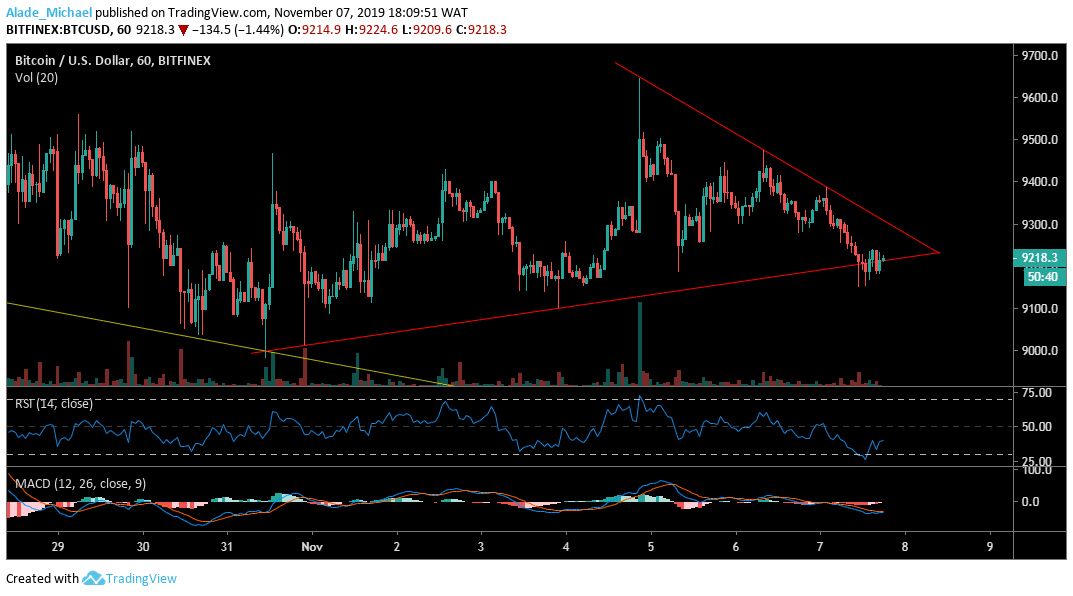
Now that Bitcoin has roaming on the triangle’s support, we may now consider the $9100 to be the next Bitcoin trading zone. Since the weekly opening, BTC has been cutting $100 from its daily price. On Monday, Bitcoin traded around $9500, Tuesday $9400, Wednesday $9300 and could probably close below $9200. However, $9000 is still holding as support, followed by $8900 and $8800 on a short-term bearish move.

If Bitcoin can hold support well at $9100, we may see a quick recovery to $9300, 9400 and $9500 on the upside. Meanwhile, the RSI is defiantly in a downward position to show a sign of weakness in price. On the MACD indicator, Bitcoin has seen a bearish cross, which suggested that selling pressure is more likely to become heavy in future trading.
- Broker
- Min Deposit
- Score
- Visit Broker
- Award-winning Cryptocurrency trading platform
- $100 minimum deposit,
- FCA & Cysec regulated
- 20% welcome bonus of upto $10,000
- Minimum deposit $100
- Verify your account before the bonus is credited
- Fund Moneta Markets account with a minimum of $250
- Opt in using the form to claim your 50% deposit bonus
Learn to Trade
Never Miss A Trade Again

Signal Notification
Real-time signal notifications whenever a signal is opened, closes or Updated

Get Alerts
Immediate alerts to your email and mobile phone.

Entry Price Levels
Entry price level for every signal Just choose one of our Top Brokers in the list above to get all this free.


