Bitcoin (BTC) Price Analysis: 4H Chart – Bearish
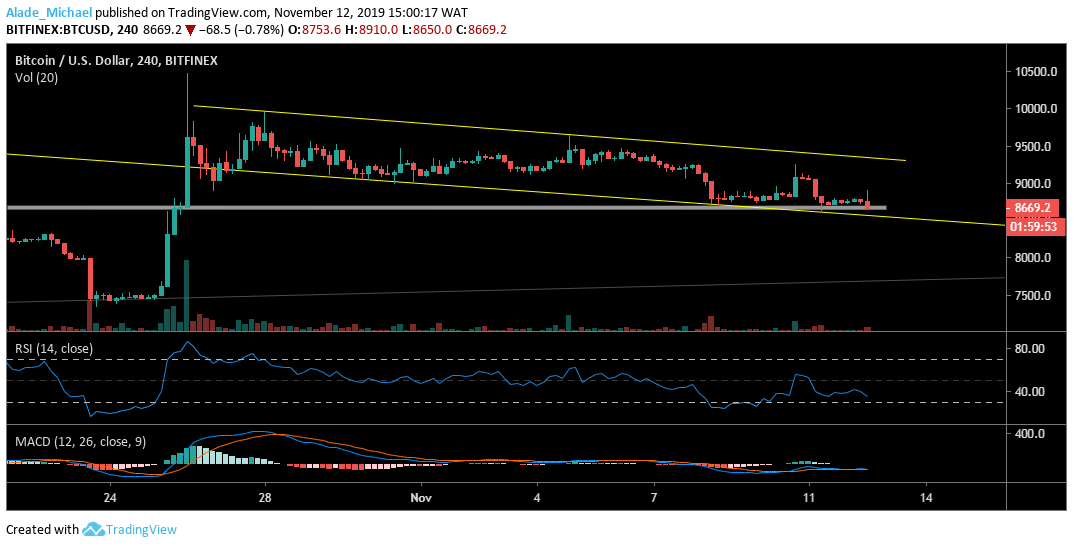
Key resistance levels: $8900, $9000, $9125
Key support levels: $8600, $8400, $8100
Just a few minutes ago, Bitcoin tried to retrace back to the $9125 resistance but the bullish correction was halted at $8900 resistance and it has made the price of BTC to fall back below the $8700. Currently, the bears are eyeing the channel’s support at $8400 –where Bitcoin is likely to run a proper retracement. If the channel’s lower boundary fails to function as support, Bitcoin may slip to $8100 support, inside the descending channel that was formed in June.

Technically, Bitcoin is locating support on the RSI 30 level. If this mentioned level can provide a rebound for the market, we can expect the price to correct gains to $8900, $9000 and $9125 resistance. At the time of writing, BTC is showing weakness on the MACD as more heavy selling pressure is likely to occur in the coming hours.
Bitcoin (BTC) Price Analysis: Hourly Chart – Bearish
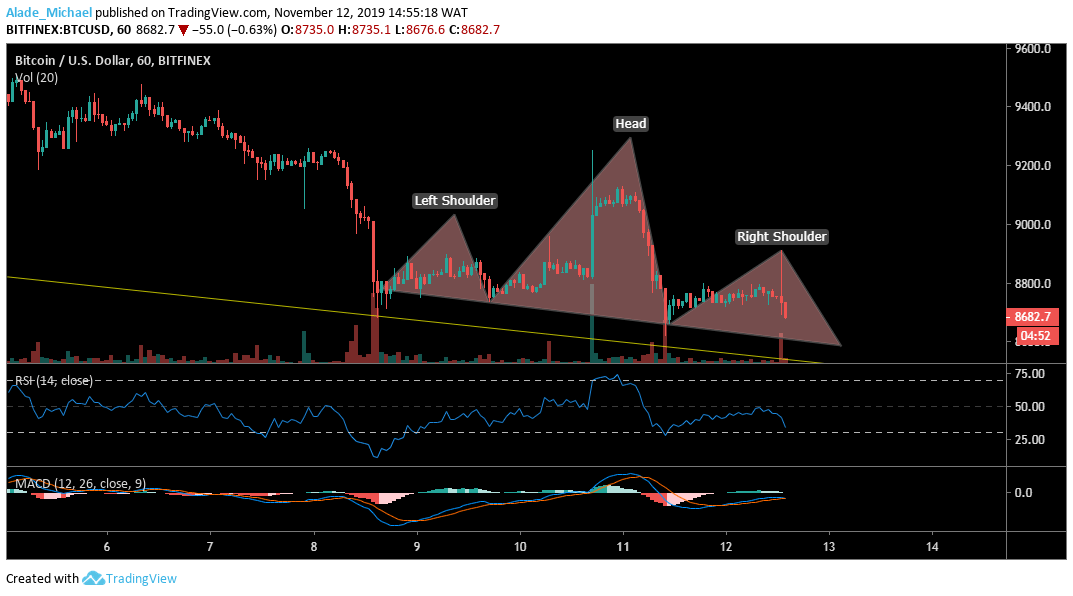
Looking at the last hourly pin-bar candle close, Bitcoin’s price may become devastating if the bearish signal eventually plays out. The market is now forming a bearish head and shoulder pattern as Bitcoin almost completes the right shoulder at $8600 support. This pattern formation could cause a heavy selling pressure if the neckline breaks. In no time, the $8400 and $8200 support may come into play.

As we can see, Bitcoin has turned away from the RSI 50, now facing the RSI 30. Should the price further drives lower, we may experience serious bearish actions. Additionally, the market has continued to follow a bearish scenario on the MACD. However, if the bulls can reinforce heavily, we can expect a little price gain to $8800 and $8900 on the right shoulder. A further price push may allow the bulls to test the $9000 once more.
BITCOIN SELL SIGNAL
Pending Order
Sell Entry: $8591
TP: $8467
SL: 8770
- Broker
- Min Deposit
- Score
- Visit Broker
- Award-winning Cryptocurrency trading platform
- $100 minimum deposit,
- FCA & Cysec regulated
- 20% welcome bonus of upto $10,000
- Minimum deposit $100
- Verify your account before the bonus is credited
- Fund Moneta Markets account with a minimum of $250
- Opt in using the form to claim your 50% deposit bonus
Learn to Trade
Never Miss A Trade Again

Signal Notification
Real-time signal notifications whenever a signal is opened, closes or Updated

Get Alerts
Immediate alerts to your email and mobile phone.

Entry Price Levels
Entry price level for every signal Just choose one of our Top Brokers in the list above to get all this free.


