Bitcoin (BTC) Price Analysis: Daily Chart – Bearish
Key resistance levels: $8880, $9000
Key support levels: $8300, $8000
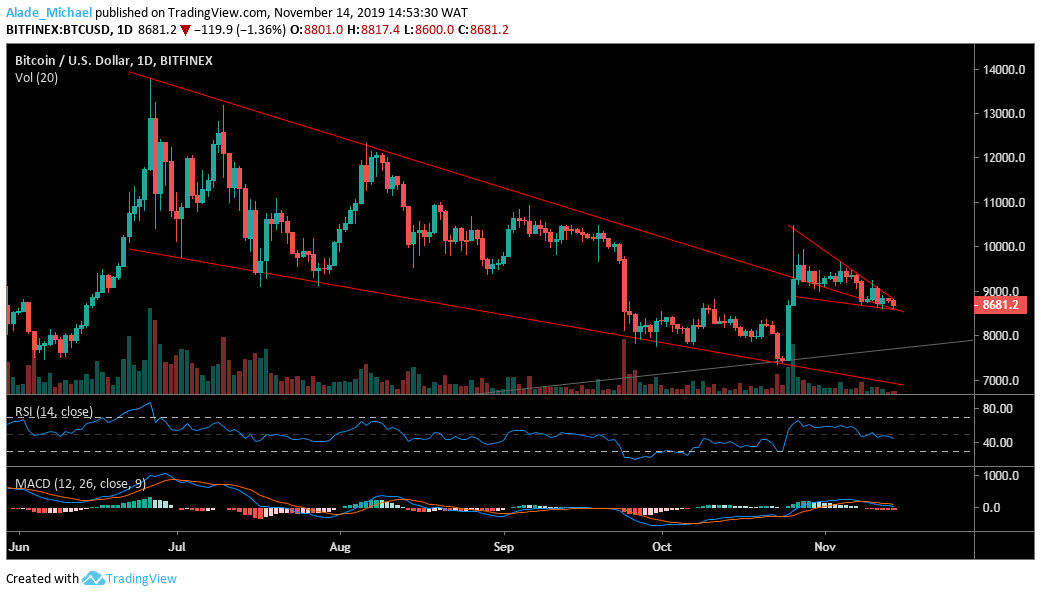
Looking at the daily chart, Bitcoin has continued to float on the $8600 support over two days. If the support breaks, the closest support to watch out for is the $8300 and $8000. There’s a higher chance for that as long as the bears remain in the market. Meanwhile, the weekly short opening has kept BTC price in an ugly scenario. We can see that the RSI has dropped well below the 50 levels.

Conversely, the MACD is showing a weakening moment but has remained in the positive zone. As it is now, it may be difficult for the bulls to regain momentum. But if we can have a daily close above the $8880 resistance, the bulls hope may be rekindled as $9000 resistance would be the next buying target. Once we climb back above the mention supports, Bitcoin should be ready for the next bullish rally.
Bitcoin (BTC) Price Analysis: 4H Chart – Bearish
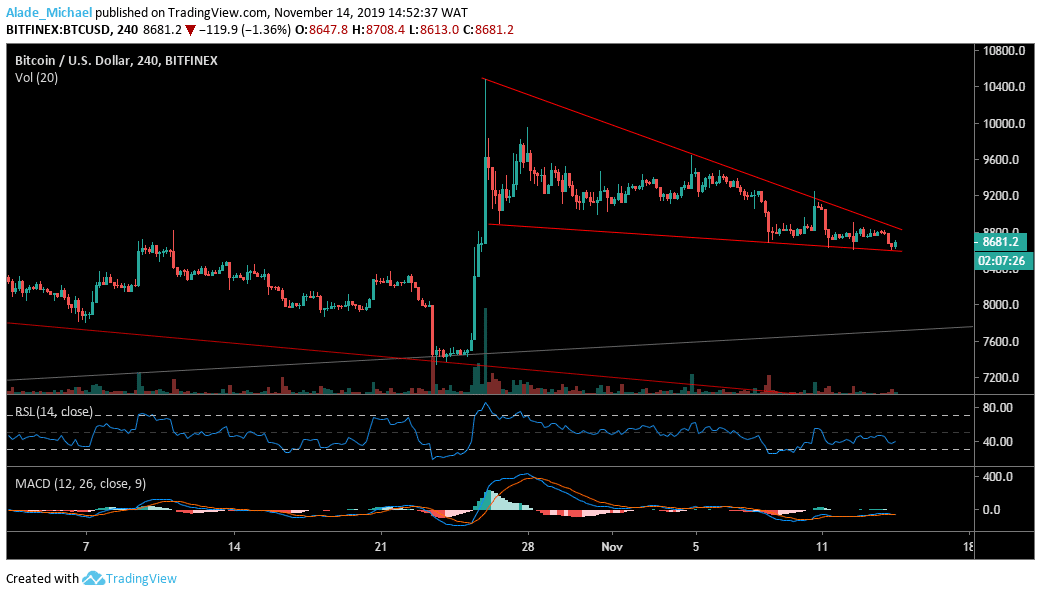
Since yesterday, Bitcoin reached a fractal level for a breakout on the 4-hour chart but has been keeping us in suspense against the next major move. From a technical standpoint, a big shock-wave is lurking around the corner. For a down surge, immediate support lies at $8400, $8200 and $8000. This could make the technical indicators to slip their bearish zone the more.

If an upsurge occurs, Bitcoin is most likely to spike to the previous high at $10350. However, BTC needs to reclaim the $8800, $8880 and $9000 resistance before we can consider a breakout. Looking at the RSI indicator, Bitcoin is climbing slowly to signal a bullish divergence, although still struggling below the 50 levels. Inversely, the MACD is negative but keeping a sideways movement to reveal the recent squeeze in the market.
BITCOIN SELL SIGNAL
Sell Entry: $8677
TP: $8550
SL: 8942
- Broker
- Min Deposit
- Score
- Visit Broker
- Award-winning Cryptocurrency trading platform
- $100 minimum deposit,
- FCA & Cysec regulated
- 20% welcome bonus of upto $10,000
- Minimum deposit $100
- Verify your account before the bonus is credited
- Fund Moneta Markets account with a minimum of $250
- Opt in using the form to claim your 50% deposit bonus
Learn to Trade
Never Miss A Trade Again

Signal Notification
Real-time signal notifications whenever a signal is opened, closes or Updated

Get Alerts
Immediate alerts to your email and mobile phone.

Entry Price Levels
Entry price level for every signal Just choose one of our Top Brokers in the list above to get all this free.


