Bitcoin (BTC) Price Analysis: Weekly Chart – Bearish
Key resistance levels: $7600, $8000, $8400
Key support levels: $7000, $6600, $6000
As shown on the weekly chart, the six-month bearish trend may end soon if Bitcoin can find a bottom on the November 2018 drop level on the white horizontal support zones. Before the price can drops to the white zone ($6000), Bitcoin needs to break the $6600 support that was established on November 25.
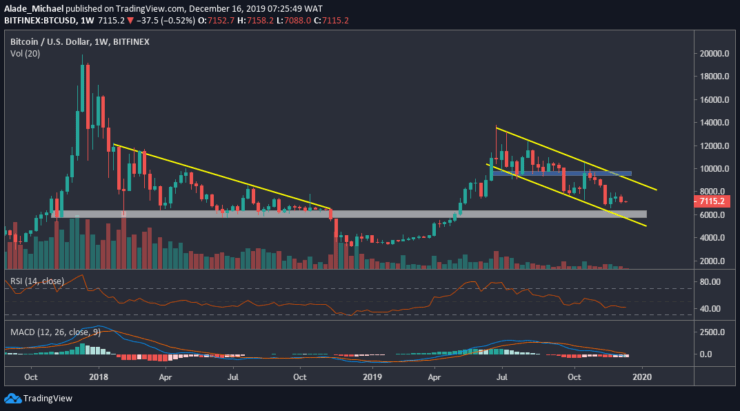
A look at the technical indicator suggested that Bitcoin is slowly locating the lower boundary of the RSI. If the market can produce support around the mentioned support zones along with the RSI 30 level; the price of Bitcoin is expected to bounce back to $7600 and $8400 resistance. The MACD is currently on the downside but it may regain strength if the zero levels can provide support.
Bitcoin (BTC) Price Analysis: Daily Chart – Bearish
The daily chart for Bitcoin shows that the bearish action is still very much dominant in the market. Following the late October bearish continuation from channel’s upper boundary at $10480; Bitcoin’s price is now trading at $7100 at the moment. The selling pressure could extend to the white horizontal support zones at $6000. Though, the $7000 and $6600 support are key important levels for the bears.
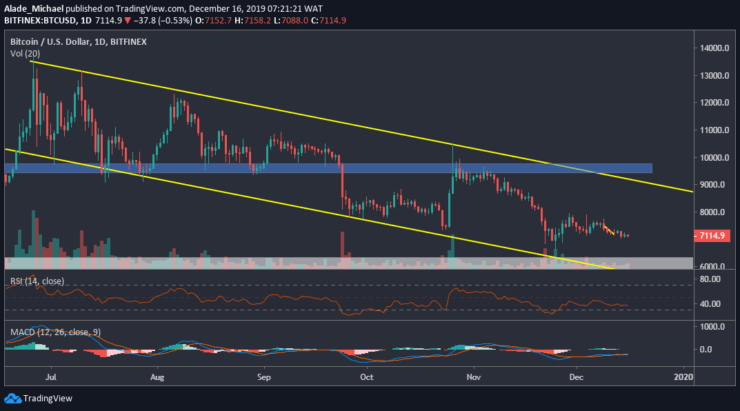
However, if these mentioned supports keep holding price actions well, Bitcoin is likely to correct to $7600 and $8000 resistance before breaking to $8400. However, a short-term break at $7200 would confirm a bullish swing for Bitcoin. Currently, the sellers are gaining control of the market. Technically, the RSI and MACD are revealed in a downward position- showing that the bearish bias is dominant.
BITCOIN SELL SIGNAL
Sell Entry: $7115
TP: $7050
SL: $7200
- Broker
- Min Deposit
- Score
- Visit Broker

- Award-winning Cryptocurrency trading platform
- $100 minimum deposit,
- FCA & Cysec regulated

- 20% welcome bonus of upto $10,000
- Minimum deposit $100
- Verify your account before the bonus is credited
- Fund Moneta Markets account with a minimum of $250
- Opt in using the form to claim your 50% deposit bonus
Learn to Trade
Never Miss A Trade Again

Signal Notification
Real-time signal notifications whenever a signal is opened, closes or Updated

Get Alerts
Immediate alerts to your email and mobile phone.

Entry Price Levels
Entry price level for every signal Just choose one of our Top Brokers in the list above to get all this free.