Bitcoin (BTC) Price Analysis: Daily Chart – Bearish
Key resistance levels: $7300, $7500
Key support levels: $6800, $6500
Following the weekly price drop, Bitcoin is now trading close to the channel’s lower boundary that has been forming since June. The sellers are still much around as Bitcoin is likely to bottom at $6500. But currently, the market is sitting on $6800 support after plummeting all the way from $7700 today. The recent surge has led the technical indicators at their lowest levels, keeping traders abreast more potential sell-off in the market.
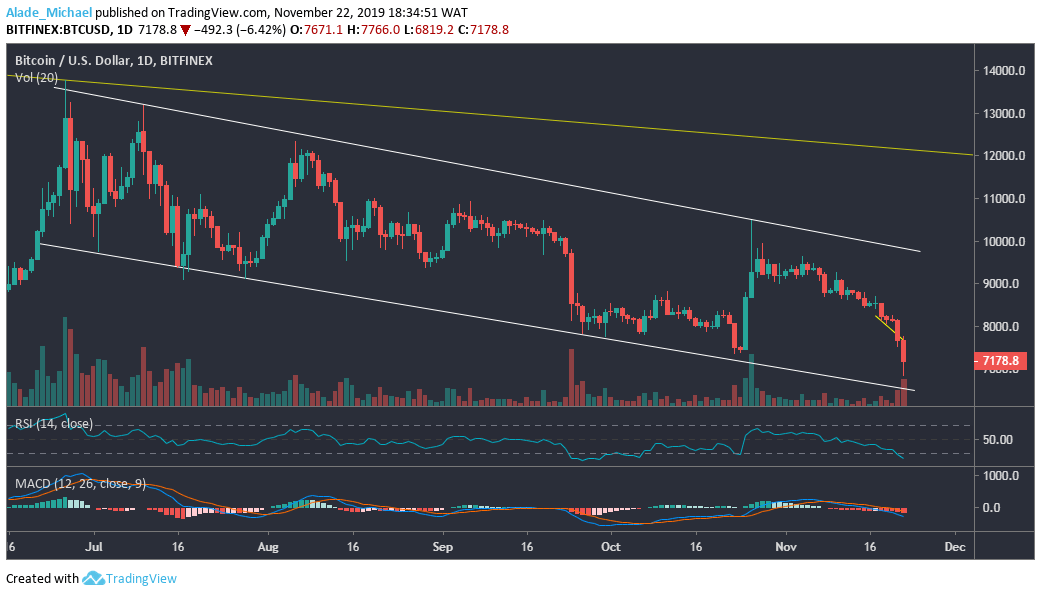
However, Bitcoin may climb back if the price keeps respecting the five months descending channel. A retracement level lies for Bitcoin at $7300 and $7500 resistance. The bearish scenario might get worse if the market slips beneath the channel. For now, Bitcoin is gathering momentum for the next colossal drop which could play out before the close the US session.
Bitcoin (BTC) Price Analysis: 15MChart – Bearish
From the $6800 low, Bitcoin has seen a little gain to where it’s currently trading at $7179. The retracement might reach $7350 resistance if the bulls can push the market further. Even though buying pressure increase, there’s a high probability for a bearish take-over at the pennant resistance (white) before witnessing a massive decline to $7000, $6800 and beyond.
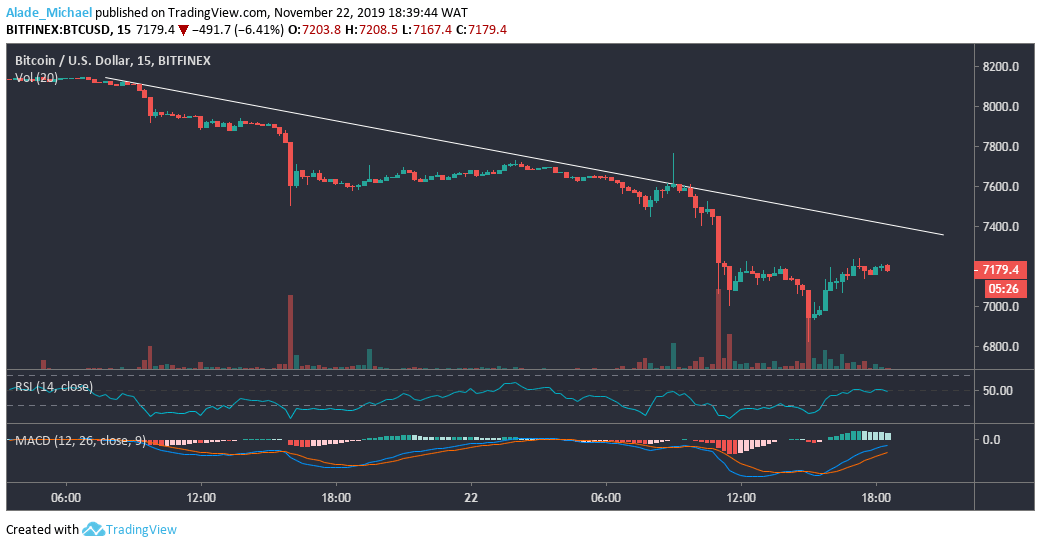
A successful break above the white resistance line may see Bitcoin through to $7500 and $7700 resistance zones, where BTC records the daily high. A further buy could lead to more bullish sentiment. With the current market condition, there’s a more fall ahead for Bitcoin. As we can see, the RSI is now facing resistance at 50 levels after a slow positive rebound. However, selling could get severe if the MACD continues to turn away at the zero levels.
BITCOIN SELL SIGNAL
Sell Entry: $7188
TP: $6500
SL: 7211
- Broker
- Min Deposit
- Score
- Visit Broker

- Award-winning Cryptocurrency trading platform
- $100 minimum deposit,
- FCA & Cysec regulated

- 20% welcome bonus of upto $10,000
- Minimum deposit $100
- Verify your account before the bonus is credited
- Fund Moneta Markets account with a minimum of $250
- Opt in using the form to claim your 50% deposit bonus
Learn to Trade
Never Miss A Trade Again

Signal Notification
Real-time signal notifications whenever a signal is opened, closes or Updated

Get Alerts
Immediate alerts to your email and mobile phone.

Entry Price Levels
Entry price level for every signal Just choose one of our Top Brokers in the list above to get all this free.