Key Support Zones: $7, 000, $6, 000, $5,000
BTC/USD Long-term Trend: Bearish
Bitcoin is currently stuck between $8,400 and $8,800. The bears attempted to pull out of the range but are still stuck in the range. Analysts are of the view that the downtrend ought to have fallen to the low of $8,200 or $8,400. Rather, BTC is fluctuating between $8,400 and $8.800. A breakdown at the $8,400 support will cause Bitcoin to fall to the next support of $8,200. On another hand, a rebound at the support of $8,200 will propel Bitcoin to reach a high of $9,200.
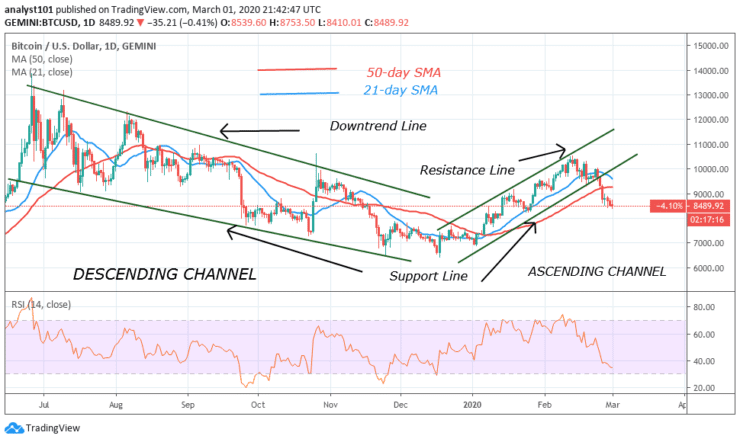
Daily Chart Indicators Reading:
Bitcoin is trading at level 35 of the Relative Strength Index period 14. The market is approaching the oversold region of the RSI. Bitcoin is also below the centerline 50. The 50-day SMA and 21-day SMA are pointing southward indicating the downtrend trend.
BTC/USD Medium-term Trend: Bearish
On the 4- hour chart, the resistance at $10,000 has made the coin to fall and fluctuate at the bottom of the chart. The price is consolidating above the $8,500 support. For the 5 days, the current support is yet to be broken.
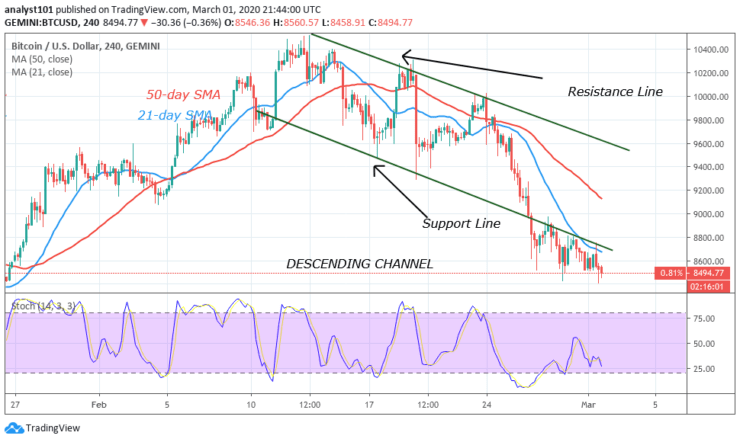
4-hour Chart Indicators Reading
Unquestionably, Bitcoin is above 25% range of the stochastic. This indicates that the coin is in bullish momentum. The price has broken below the 21-day SMA and 50-day SMA indicating that the downtrend has resumed.
General Outlook for Bitcoin (BTC)
Bitcoin is still in a tight range. The price consolidates between $8,400 and $8,800. There has been no significant price movement in the last 48 hours. Certainly, it is becoming clearer that sellers have taken control of price as BTC reaches a low of $8,500. Unquestionably, the downtrend will continue as the price bars are beneath the EMAs which propels the downtrend. The lower channel of the ascending channel has been broken signifying the termination of the uptrend.
Instrument: BTC/USD
Order: sell
Entry price: $8,531
Stop: $9,000
Target: $8,000
Note: Learn2Trade.com is not a financial advisor. Do your research before investing your funds in any financial asset or presented product or event. We are not responsible for your investing results
- Broker
- Min Deposit
- Score
- Visit Broker

- Award-winning Cryptocurrency trading platform
- $100 minimum deposit,
- FCA & Cysec regulated

- 20% welcome bonus of upto $10,000
- Minimum deposit $100
- Verify your account before the bonus is credited
- Fund Moneta Markets account with a minimum of $250
- Opt in using the form to claim your 50% deposit bonus
Learn to Trade
Never Miss A Trade Again

Signal Notification
Real-time signal notifications whenever a signal is opened, closes or Updated

Get Alerts
Immediate alerts to your email and mobile phone.

Entry Price Levels
Entry price level for every signal Just choose one of our Top Brokers in the list above to get all this free.