Don’t invest unless you’re prepared to lose all the money you invest. This is a high-risk investment and you are unlikely to be protected if something goes wrong. Take 2 minutes to learn more
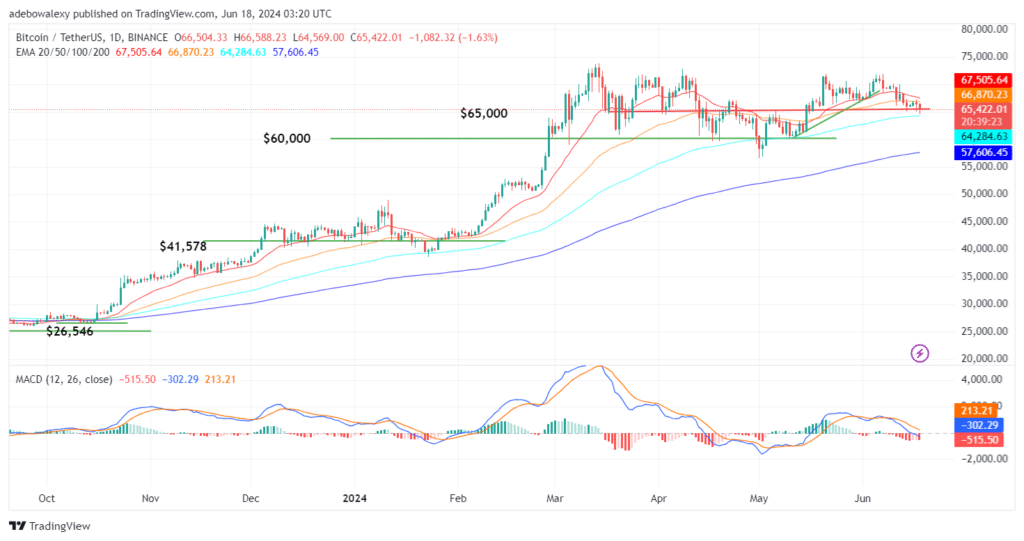
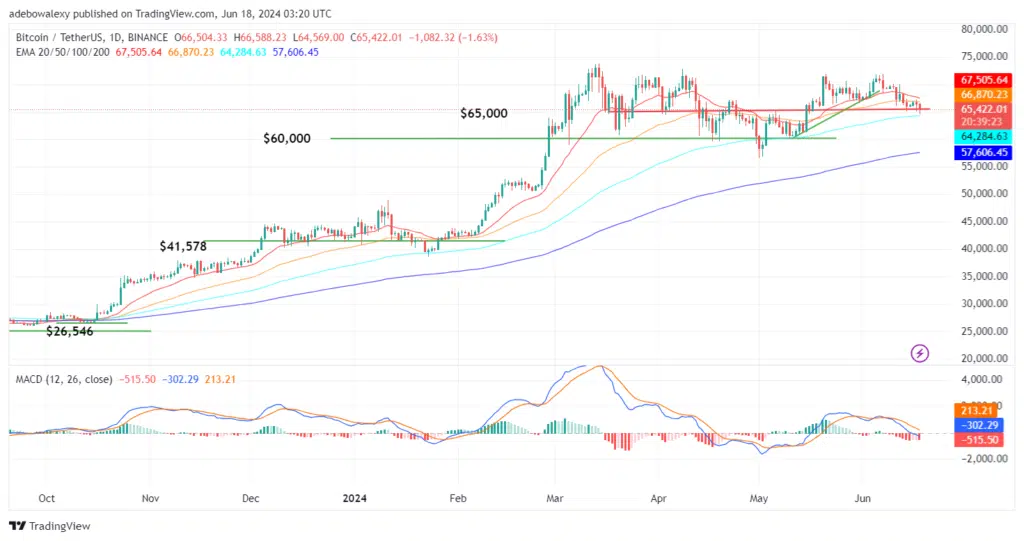
Since Bitcoin’s price action fell back below the $70,000 mark, the coin hasn’t yet gained the needed momentum to rise back above that threshold. Rather, the market has been hovering closer to the technical support at the $65,000 mark. Let’s try to see what may soon evolve in this market.
Since about three sessions ago, price action has fallen below the 50-day Exponential Moving Average (EMA) curve on the Bitcoin daily price chart. Meanwhile, the previous session saw the market correct off the EMA line, while the current session seems to have gained more bearish momentum.
At this point, this crypto now trades midway between the 20, 50-day, and 100- and 200-day EMA lines. Consequently, this seems to indicate some indecision in the market. Simultaneously, the Moving Average Convergence Divergence (MACD) indicator’s leading lines have fallen below the equilibrium level. Likewise, its last bar is now solid red, hinting that downward forces may grow stronger henceforth.
BTC Upside Hopes Look Gloomy
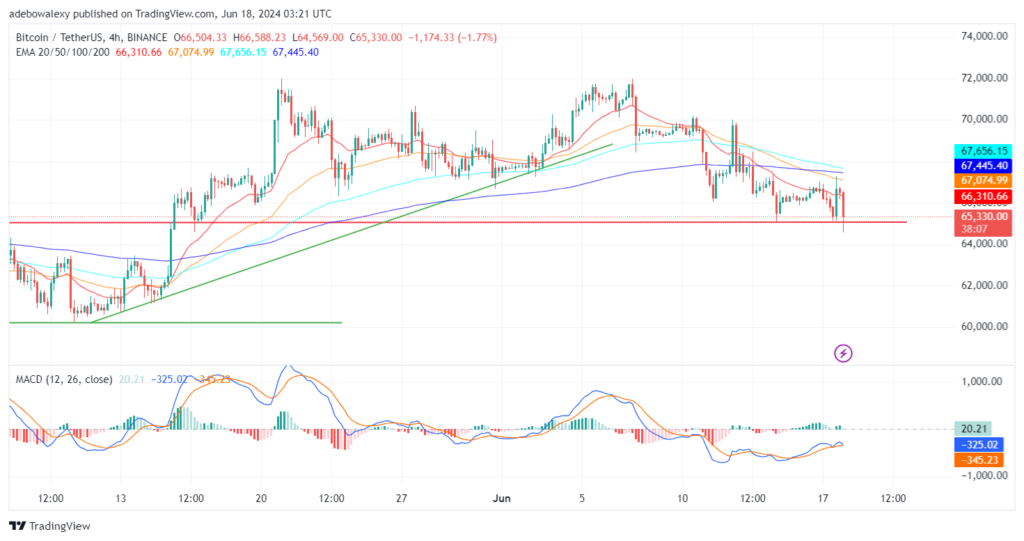
The Bitcoin 4-hour market reveals that hopes of a significant upside correction at this point may be dashed. This is because technical indicators appear to be predicting that downward forces may grow stronger. In the 4-hour market, price action has fallen below all the EMA lines.
Likewise, the MACD lines are now below the equilibrium level and have converged for a bearish crossover. Already, the last bar of the indicator is now pale green concerning the convergence. This shows that headwinds may cause price action in this market to revisit trading below the $65,000 mark. So, traders might want to use crypto signals targeting regions below this price level.
Trade on MT4 with Leverage up to 1:500! Trade on MT4 with Leverage up to 1:500!
X
We use cookies to ensure that we give you the best experience on our website. If you continue to use this site we will assume that you are happy with it.