Bulls will soon dominate BNBUSD Coin market soon
BNBUSD Price Analysis 30 June
The $276 resistance level can be broken on the upside, testing the $286 resistance level, if buyers can hold off against the $254 resistance level. Binance Coin may drop to its most recent lows of $219 and $200 if sellers get additional traction before closing below the $240 psychological level.
BNB/USD Market
Key levels:
Supply levels: $254, $276, $286
Demand levels: $240, $219, $200
BNBUSD Long-term Trend: Bullish
On the daily chart, BNBUSD is Positive. The price action of the Binance Coin has formed a double-bottom chart pattern. This is a bullish reversal chart pattern formed at $219 support level. When Binance Coin tested the just mentioned level twice on 12 June and 28 June, a bullish trend may commence. Buyers may grab over as soon as the bulls intensify their pressure. For a few days, the price fluctuates within a small range of $219 and $239 levels. As the bullish trend grows stronger, pressure on the $254 level will rise.
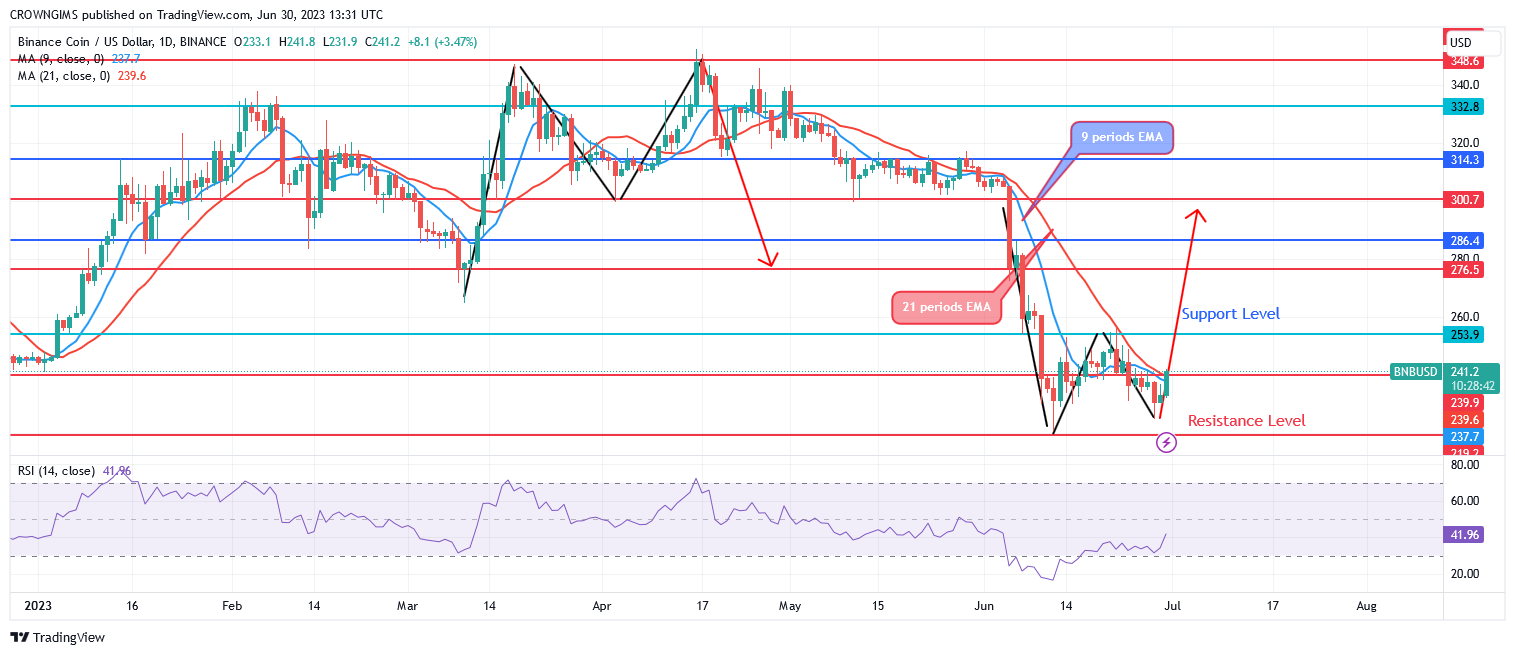
A bullish swing is indicated by the upward crossover of the 21-period EMA by the 9-period EMA. The price of the Binance Coin is trying to outperforming the two EMAs. The $276 resistance level can be broken on the upside, testing the $286 resistance level, if buyers can hold off against the $254 resistance level. Binance Coin may drop to its most recent lows of $219 and $200 if sellers get additional traction before closing below the $240 psychological level.
BNBUSD medium-term Trend: Bullish
On the four-hour chart, Binance Coin is on a bullish movement. At a price of $219 on June 12, the double bottom chart pattern initially appeared, signaling that buyers are about to take control of the market. The sellers’ interest decreased after the forced price test at the $253 barrier level. Prices are gradually increasing and are now close to $254 as customer demand has increased.
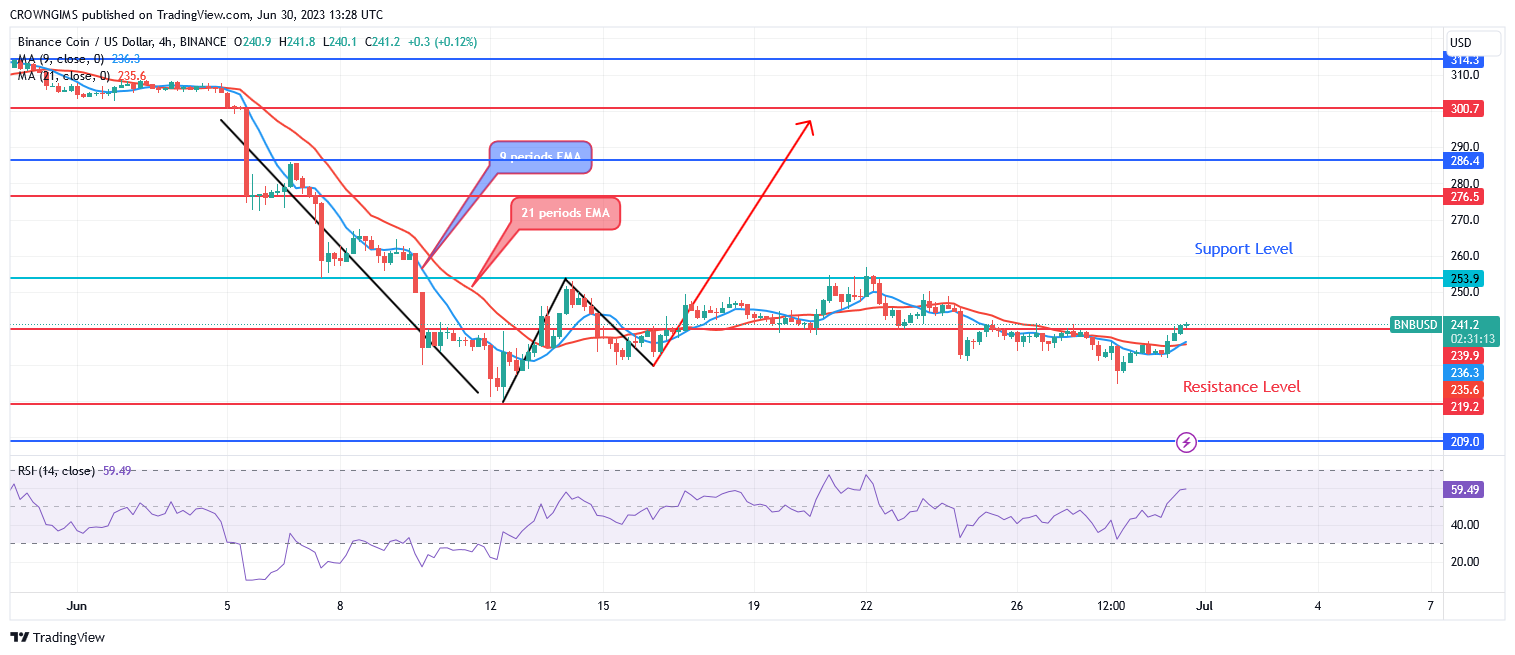
Indicating a bullish market, Binance Coin is now trading below the 9- and 21-period exponential moving averages. Relative strength index period 14 implies a sell when the signal line is pointing down at 46 levels which may be a pullback.
You can purchase Lucky Block – Guide, Tips & Insights | Learn 2 Trade here. Buy LBLOCK
- Broker
- Min Deposit
- Score
- Visit Broker

- Award-winning Cryptocurrency trading platform
- $100 minimum deposit,
- FCA & Cysec regulated

- 20% welcome bonus of upto $10,000
- Minimum deposit $100
- Verify your account before the bonus is credited
- Fund Moneta Markets account with a minimum of $250
- Opt in using the form to claim your 50% deposit bonus
Learn to Trade
Never Miss A Trade Again

Signal Notification
Real-time signal notifications whenever a signal is opened, closes or Updated

Get Alerts
Immediate alerts to your email and mobile phone.

Entry Price Levels
Entry price level for every signal Just choose one of our Top Brokers in the list above to get all this free.