Bulls may dominate BNBUSD Coin market soon
BNBUSD Price Analysis 23 June
Binance Coin may drop to its most recent lows of $219 and $200 if sellers get additional traction before closing below the $240 psychological level. The $276 resistance level can be broken on the upside, testing the $286 resistance level, if buyers can hold off against the $254 resistance level.
BNB/USD Market
Key levels:
Supply levels: $254, $276, $286
Demand levels: $240, $219, $200
BNBUSD Long-term Trend: Bearish
On the daily chart, BNBUSD is negative When Binance coin peaked on March 18 at $348, a bearish trend began. Sellers grabbed over as soon as the bullish trend ended. For a few days, the price fluctuates within a small range before tumbling below the $314 support level. As the bearish trend grew stronger, pressure on the $300 level rose. The price dropped below the $276 and $254 levels as permitted by the $286 barrier. The buyers appear to be against further price cuts at the $240 support level. At the moment, price is fluctuating between $254 and $240 levels.
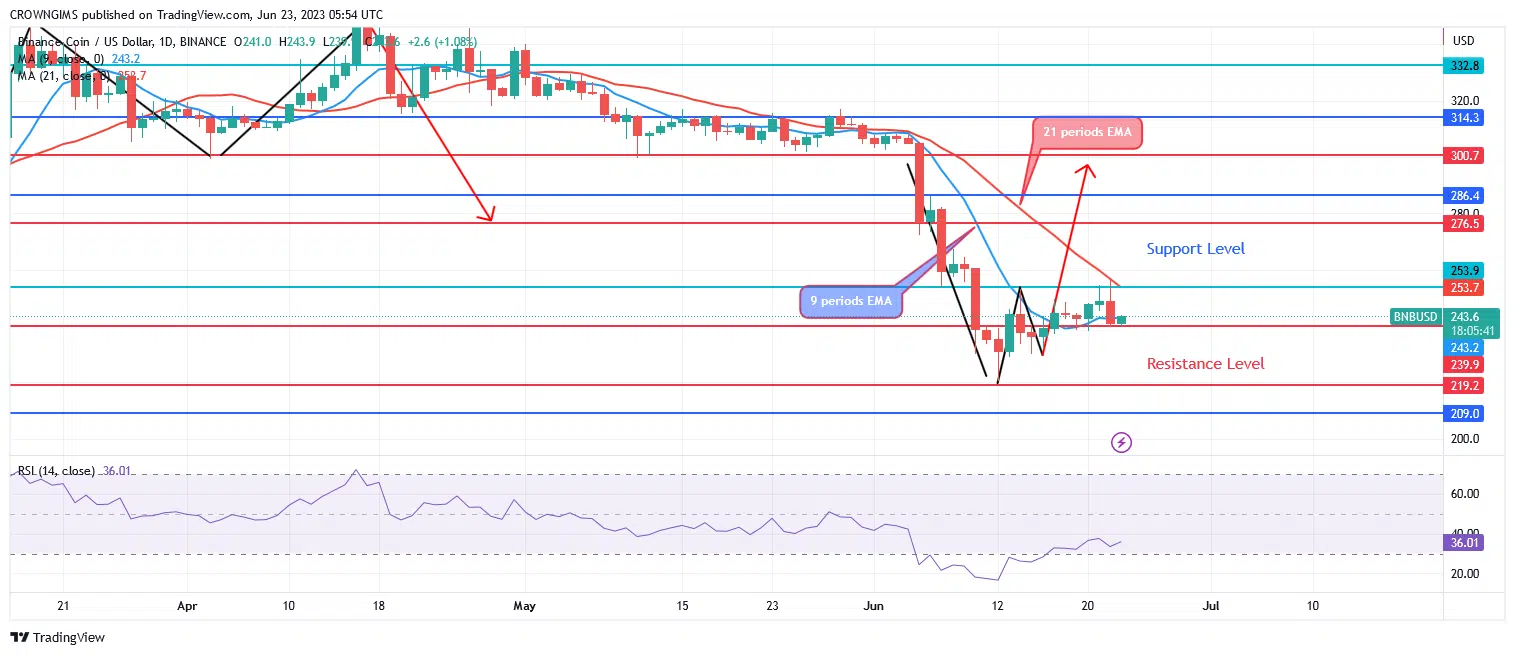
A bearish swing is indicated by the downward crossover of the 21-period EMA by the 9-period EMA. The price of the Binance Coin is now outperforming the two EMAs. Binance Coin may drop to its most recent lows of $219 and $200 if sellers get additional traction before closing below the $240 psychological level. The $276 resistance level can be broken on the upside, testing the $286 resistance level, if buyers can hold off against the $254 resistance level.
BNBUSD medium-term Trend: Ranging
On the four-hour chart, Binance Coin is on ranging movement. The double bottom chart pattern first showed on June 12 at a price of $219, indicating that buyers are set to seize control of the market. The forced price test at $253 barrier level reduced sellers’ interest. Prices are gradually rising approaching $254 as demand from consumers has grown. The bulls’ and the bears’ momentum become low and the price is ranging within $254 and $240 levels.
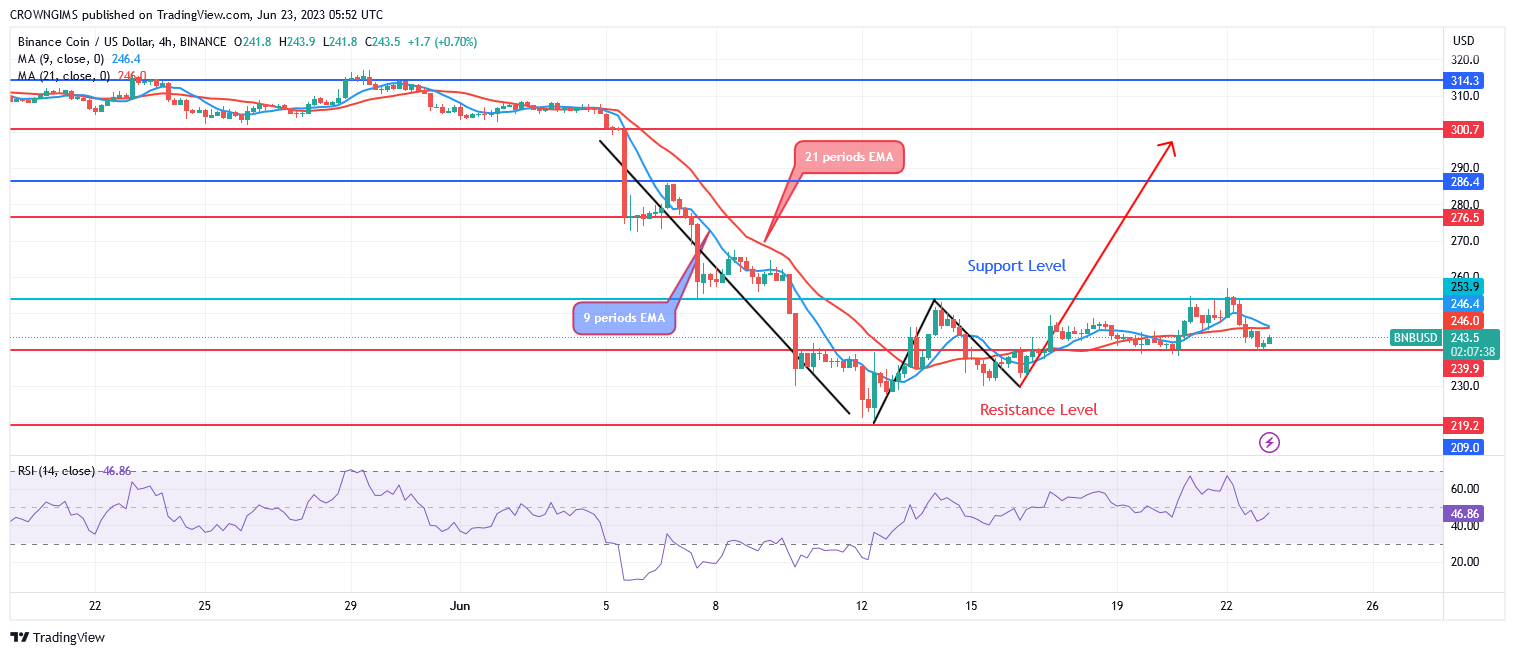
Indicating a bearish market, Binance Coin is now trading below the 9- and 21-period exponential moving averages. Relative strength index period 14 implies a sell when the signal line is pointing down at 44 levels.
You can purchase Lucky Block – Guide, Tips & Insights | Learn 2 Trade here. Buy LBLOCK
- Broker
- Min Deposit
- Score
- Visit Broker

- Award-winning Cryptocurrency trading platform
- $100 minimum deposit,
- FCA & Cysec regulated

- 20% welcome bonus of upto $10,000
- Minimum deposit $100
- Verify your account before the bonus is credited
- Fund Moneta Markets account with a minimum of $250
- Opt in using the form to claim your 50% deposit bonus
Learn to Trade
Never Miss A Trade Again

Signal Notification
Real-time signal notifications whenever a signal is opened, closes or Updated

Get Alerts
Immediate alerts to your email and mobile phone.

Entry Price Levels
Entry price level for every signal Just choose one of our Top Brokers in the list above to get all this free.