BNBUSD Price Analysis – October 30
The price is targeting the support level at $26, if it does not hold the coin will reduce to support level at $24 and $22. In case the $26 price level, it may bounce and increase towards the resistance levelsat$29,$31, and $33.
BNB/USD Market
Key levels:
Supply levels: $29, $31, $33
Demand levels: $26, $24, $22
BNBUSD Long-term Trend: Bearish
BNBUSD is bearish on the daily chart. The coin was under the control of the bulls last week. The bullish momentum pushes the price to the resistance level of $31 on October 15. The price pulled back and retest the support level of $29. The coin was prevented from penetrating the level and the bulls pushed it up to test the resistance level at $29 second time on October 28. The price falls and penetrates the support level at $29.
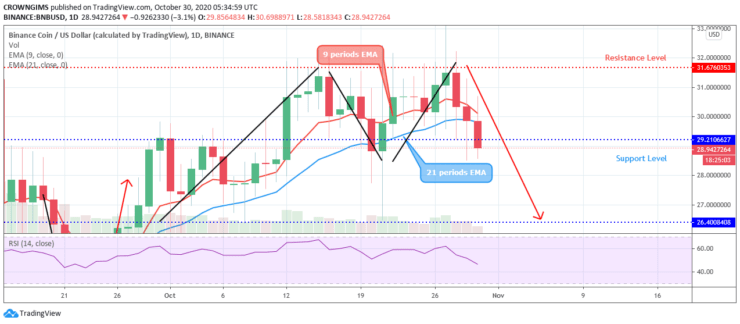
The coin has penetrates the dynamic support level downside with the formation of a strong bearish candle. The 9 periods EMA is crossing the 21 periods EMA downside to establish the bearish movement. The price is targeting the support level at $26, if it does not hold the coin will reduce to support level at $24 and $22. In case the $26 price level, it may bounce and increase towards the resistance levelsat$29,$31, and $33. The relative strength index period 14 is bending down at 40 levels which indicates a sell signal.
BNBUSD medium-term Trend: Bearish
On the 4-hour chart, BNBUSD is bearish. The price action has formed a chart pattern called “Double Top”; this is a bearish chart pattern and this is what makes the price declining towards the support level of $26. The former support level of $29 has turned to a resistance level in the 4-hour chart.
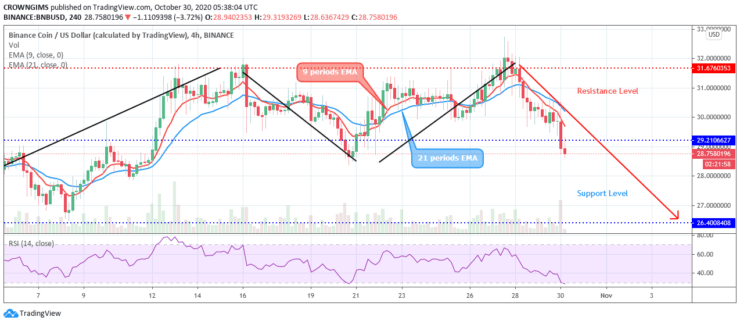
The 9 periods EMA has crossed the 21 periods EMA downside and the coin is trading below the two EMAs. The Relative Strength Index period 14 is pointing down to indicate a sell signal.
- Broker
- Min Deposit
- Score
- Visit Broker

- Award-winning Cryptocurrency trading platform
- $100 minimum deposit,
- FCA & Cysec regulated

- 20% welcome bonus of upto $10,000
- Minimum deposit $100
- Verify your account before the bonus is credited
- Fund Moneta Markets account with a minimum of $250
- Opt in using the form to claim your 50% deposit bonus
Learn to Trade
Never Miss A Trade Again

Signal Notification
Real-time signal notifications whenever a signal is opened, closes or Updated

Get Alerts
Immediate alerts to your email and mobile phone.

Entry Price Levels
Entry price level for every signal Just choose one of our Top Brokers in the list above to get all this free.