BNBUSD Price Analysis – November 06
The breakup of the $29 resistance level with the daily candle closes above the mentioned level will make the price rally towards the resistance level of $31, which may progress to $33 provided the bulls maintain their pressure.
BNB/USD Market
Key levels:
Supply levels: $29, $31, $33
Demand levels: $26, $24, $22
BNBUSD Long-term Trend: Bullish
On the daily chart, BNBUSD is bearish. The bearish momentum is getting weak. The bearish movement commenced on October 28 when the bulls could not break up the resistance level of $31. The coin declines under the pressure of the bears and the support level of $26 was reached. The bulls defend the support level of $26 and this hinders the breakdown of the level by the bears. The Doji star candle pattern is formed and the price has started an uptrend move towards the $29 price level.
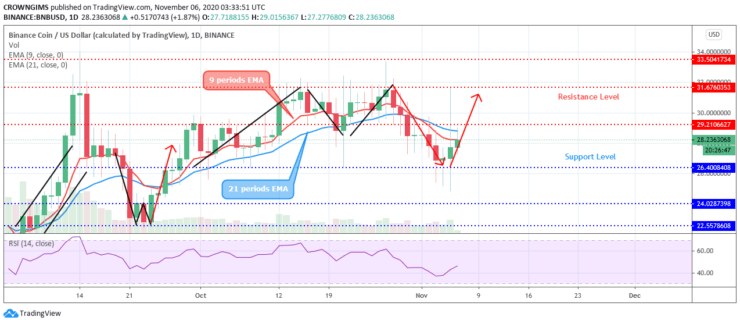
The breakup of the $29 resistance level with the daily candle closes above the mentioned level will make the price rally towards the resistance level of $31, which may progress to $33 provided the bulls maintain their pressure. In case the bears defend the resistance level of $29, the bearish trend may continue and the price may reach the previous low at $22 provided $26, and the $24 price level is penetrated. Meanwhile, the relative strength index period 14 is pointing up above 40 levels to indicate a buy signal.
BNBUSD medium-term Trend: Bullish
The Bulls are taken over the BNB market. The bearish pressure could not break down the support level of $26. Bullish Engulfing candle pattern formed; this triggers the bulls’ momentum, the coin is testing the resistance level of $29 at the moment.
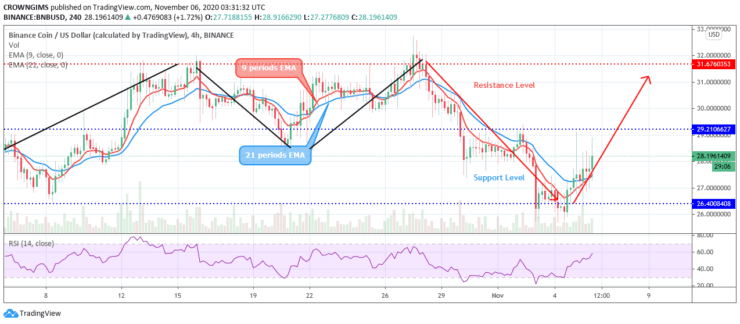
The 9 periods EMA is crossing the 21 periods EMA upside and the coin is trading above the two EMAs to indicate further increase in price. The Relative Strength Index period 14 is pointing up at 60 levels to indicate a buy signal.
- Broker
- Min Deposit
- Score
- Visit Broker

- Award-winning Cryptocurrency trading platform
- $100 minimum deposit,
- FCA & Cysec regulated

- 20% welcome bonus of upto $10,000
- Minimum deposit $100
- Verify your account before the bonus is credited
- Fund Moneta Markets account with a minimum of $250
- Opt in using the form to claim your 50% deposit bonus
Learn to Trade
Never Miss A Trade Again

Signal Notification
Real-time signal notifications whenever a signal is opened, closes or Updated

Get Alerts
Immediate alerts to your email and mobile phone.

Entry Price Levels
Entry price level for every signal Just choose one of our Top Brokers in the list above to get all this free.