BNBUSD Price Analysis – November 27
The breakdown of the support level of $26 may push down the price to the September low which is the $22 level provided the $26 and $24 price level do not hold. In case the support level of $26 holds, the price may reverse and face the resistance levels of $29, $31, and $33.
BNB/USD Market
Key levels:
Supply levels: $29, $31, $33
Demand levels: $26, $24, $22
BNBUSD Long-term Trend: Bearish
On the long-term outlook, BNBUSD is bearish. Two weeks ago, the crypto was on the ranging mode within the $29 and $26 price level. The bulls initially gained more pressure and push the coin to break out at the $29 resistance level. The price increase to test the resistance level of $33 after it breaks up the $31 level. The strong daily bearish candle emerges and interrupts the bulls on November 25. The bears continue to dominate the market and the support level of $26 was retested.
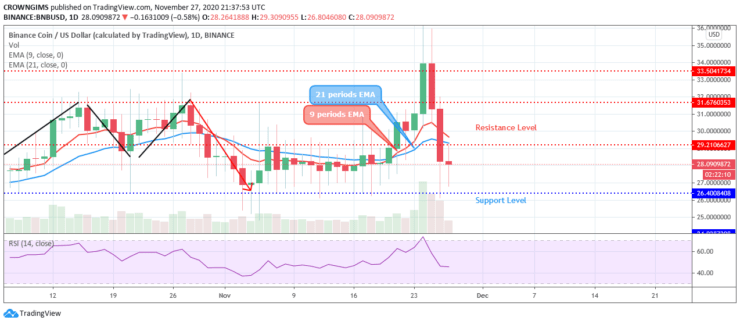
The two EMAs have been penetrated downside and the price is trading below the 9 periods EMA and 21 periods EMA which indicates that the bears are in control of the market. The breakdown of the support level of $26 may push down the price to the September low which is the $22 level provided the $26 and $24 price level do not hold. In case the support level of $26 holds, the price may reverse and face the resistance levels of $29, $31, and $33.
BNBUSD medium-term Trend: Bearish
The bulls pushed the coin to penetrate the resistance level of $33 but they are unable. The sellers gained more pressure to break down the support level of $31. The price declines to penetrate the $29.2 level which later extends to the $26.4 level.
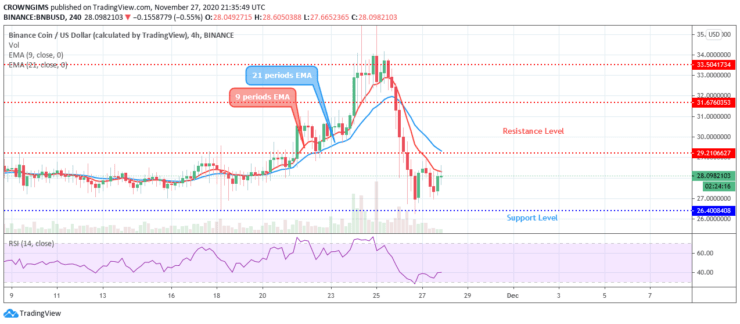
The 9 periods EMA has crossed the 21 periods EMA downside and the coin is trading below the two EMAs to indicate that the bears are in control of the BNBUSD market. The Relative Strength Index period 14 is bending down at 40 levels which indicates a sell signal.
- Broker
- Min Deposit
- Score
- Visit Broker

- Award-winning Cryptocurrency trading platform
- $100 minimum deposit,
- FCA & Cysec regulated

- 20% welcome bonus of upto $10,000
- Minimum deposit $100
- Verify your account before the bonus is credited
- Fund Moneta Markets account with a minimum of $250
- Opt in using the form to claim your 50% deposit bonus
Learn to Trade
Never Miss A Trade Again

Signal Notification
Real-time signal notifications whenever a signal is opened, closes or Updated

Get Alerts
Immediate alerts to your email and mobile phone.

Entry Price Levels
Entry price level for every signal Just choose one of our Top Brokers in the list above to get all this free.