BNBUSD Price Analysis – December 11
The ability to break down the support level of $26 will expose the price to $24 and $22. In case the support level of $26 is defended by the bulls, the price may reverse and face the $29. $33, and $37 resistance price level.
BNB/USD Market
Key levels:
Supply levels: $29, $31, $33, $37
Demand levels: $26, $24, $22
BNBUSD Long-term Trend: Bearish
BNBUSD is bearish on the long-term outlook. The price action formed a symmetrical triangle in the daily chart last week inside which the price was seeking a breakout. The bears eventually prevailed over the bulls. The price broke out at the $29 support level. The price decline towards the $26 support level and the level is tested and pulls back slightly. Today, another daily bearish candle emerges and that indicate further price reduction.
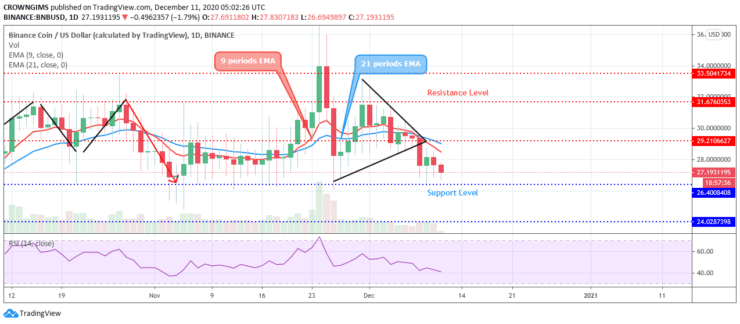
The 9 periods EMA is under 21 periods EMA and the coin is trading below the two EMAs at a distance which indicates increase in the bears’ momentum. The ability to break down the support level of $26 will expose the price to $24 and $22. In case the support level of $26 is defended by the bulls, the price may reverse and face the $29. $33, and $37 resistance price level. The Relative Strength Index period 14 is bending down at 40 levels connotes sell signal.
BNBUSD medium-term Trend: Bearish
The bears are controlling the BNBUSD market in the 4 hour chart. The bears pushed the price out of the symmetrical triangle, the former support level of $29 was penetrated down side and the price is moving closer to the support level of $26.
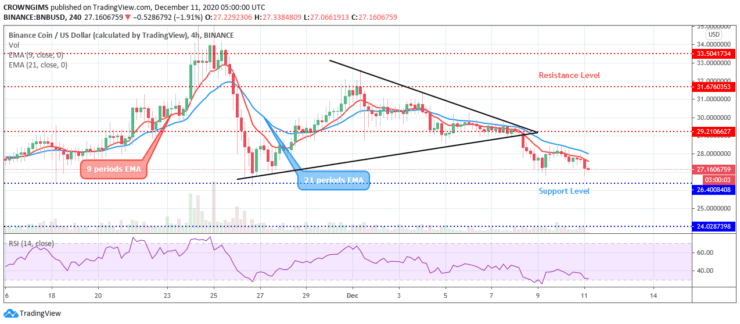
The 9 periods EMA has crossed the 21 periods EMA downside, and the price is trading below the 9 periods EMA which indicates increase in the sellers’ pressure. However, the relative strength index period 14 is at 20 levels pointing down to indicate a sell signal.
Note: Learn2.Trade is not a financial advisor. Do your research before investing your funds in any financial asset or presented product or event. We are not responsible for your investing results
- Broker
- Min Deposit
- Score
- Visit Broker

- Award-winning Cryptocurrency trading platform
- $100 minimum deposit,
- FCA & Cysec regulated

- 20% welcome bonus of upto $10,000
- Minimum deposit $100
- Verify your account before the bonus is credited
- Fund Moneta Markets account with a minimum of $250
- Opt in using the form to claim your 50% deposit bonus
Learn to Trade
Never Miss A Trade Again

Signal Notification
Real-time signal notifications whenever a signal is opened, closes or Updated

Get Alerts
Immediate alerts to your email and mobile phone.

Entry Price Levels
Entry price level for every signal Just choose one of our Top Brokers in the list above to get all this free.