Don’t invest unless you’re prepared to lose all the money you invest. This is a high-risk investment and you are unlikely to be protected if something goes wrong. Take 2 minutes to learn more
Bitget Token Price Analysis – Buyers test support with cautious recovery
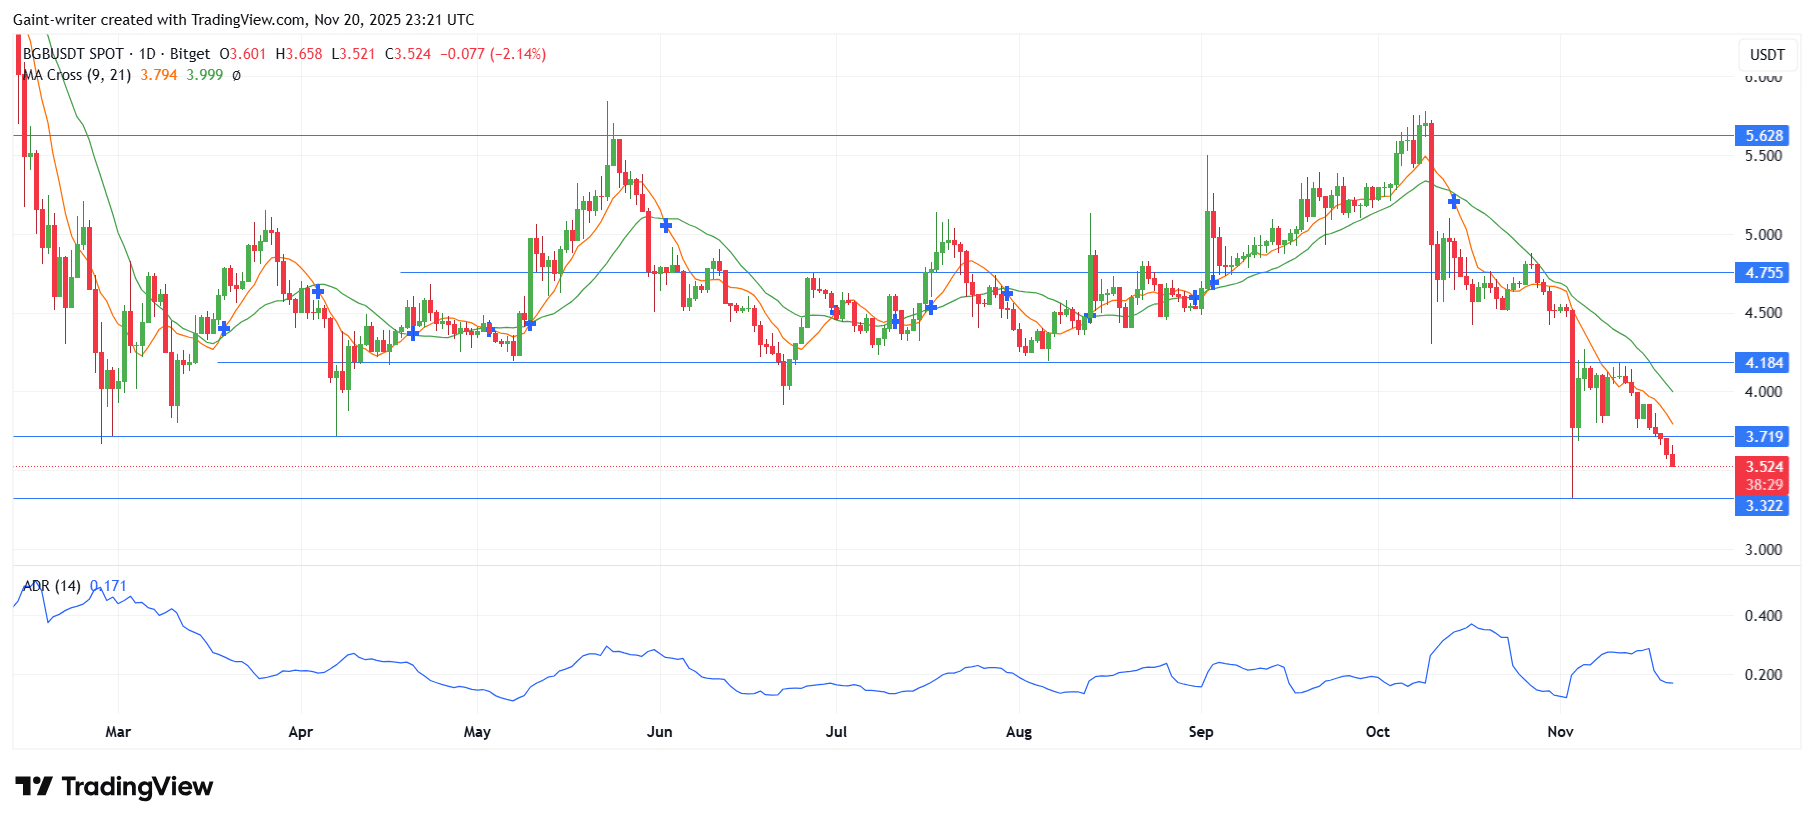
Bitget Token trades near $3.619, slipping 0.22% in the past 24 hours. After a sharp corrective move through mid‑November, price has retreated from the $4.75–$4.18 resistance region into a temporary base around $3.32. Current action shows mild recovery attempts, though momentum remains subdued and not yet indicative of a confirmed reversal.
Bitget Token Key Levels:
Support Levels: $3.322, $3.000
Resistance Levels: $3.719, $4.184
BGB/USDT Long Term Trend – Bearish (Daily Chart)
The MFI sits below neutral, signalling modest inflows but lacking conviction. The ADL has flattened after a decline, suggesting light stabilization but no strong accumulation trend. Structurally, price is attempting to form a base between $3.32–$3.72, yet recovery candles remain small and hesitant. Unless price closes decisively above $3.72, the overall trend stays weakly bearish to neutral.
.
Bitget Token’s correction mirrors broader cooling across exchange tokens after extended overperformance earlier in the year. The sharp but contained drop suggests profit‑taking rather than systemic weakness. Renewed demand remains delicate, with MFI’s mid‑range readings confirming gradual sentiment recovery rather than explosive inflows.
BGB/USDT Short Term Trend – Bullish (4 Hour Chart)
On the 4 Hour Chart, BGB trades near $3.53, consolidating after rebounding off the $3.32 support low. Price has oscillated narrowly beneath $3.72, where minor resistance continues to cap upside momentum.
Note: Learn2.trade is not a financial advisor. Do your research before investing your funds in any financial asset, product, or event. We are not responsible for your investment results
Trade on MT4 with Leverage up to 1:500! Trade on MT4 with Leverage up to 1:500!
X
We use cookies to ensure that we give you the best experience on our website. If you continue to use this site we will assume that you are happy with it.

 BGB/USDT Short Term Trend – Bullish (4 Hour Chart)


