Don’t invest unless you’re prepared to lose all the money you invest. This is a high-risk investment and you are unlikely to be protected if something goes wrong. Take 2 minutes to learn more
Avalanche Price Forecast – November 14
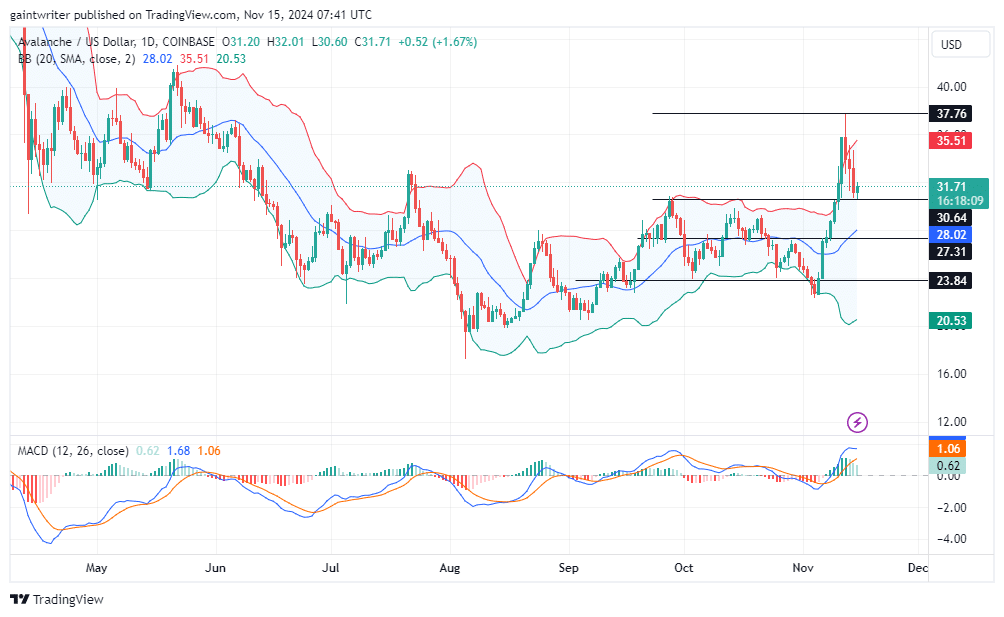
The Avalanche price forecast reveals a strong recovery effort, with buyers pressing sellers back toward the $31.710 resistance level.
AVAXUSD Long-Term Trend: Bullish (Daily Chart)
Support Levels: $30.000, $28.500
Resistance Levels: $31.710, $37.000 
Avalanche Price Forecast – AVAXUSD Outlook
The month began with a strong bullish drive, as Avalanche buyers lifted the price from $23.800 to a peak near $37.000. Although a brief sell-off interrupted this momentum, the market remains positioned for further gains. Buyers are now targeting a break above the $31.710 resistance zone, a key area where sellers previously mounted a defense. With bullish sentiment gaining traction, the market outlook remains positive.
The Bollinger Bands indicate heightened volatility, signaling the potential for significant price movements. Their expansion highlights increased trading activity and the likelihood of a breakout. Avalanche’s price currently leans toward the upper band, a bullish indication that buyers are striving to regain control.
The MACD (Moving Average Convergence Divergence) further reinforces this bullish sentiment, showing a positive crossover and a gradual rise in momentum. While earlier bearish sentiment caused a slight dip in the signal line, the MACD’s current position favors buyers. Continued momentum could trigger a stronger reversal, solidifying the bulls’ dominance.
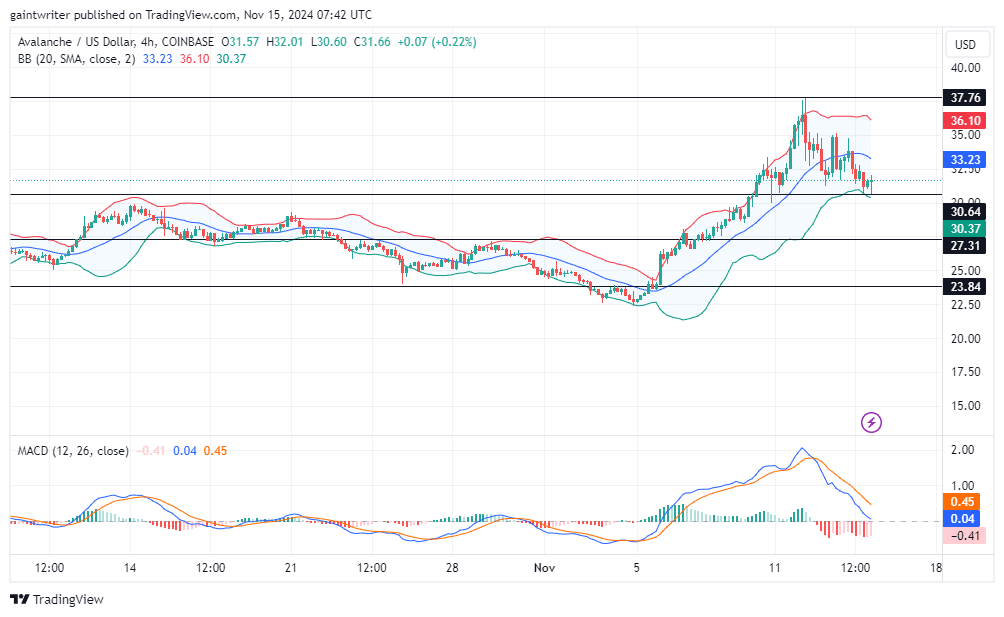
Avalanche Price Medium Term Trend: Bullish (4-hour Chart)
On shorter time frames, buyers are preparing to resume upward momentum. Although the MACD reflects some residual effects of recent bearish activity, it shows signs of recovery, pointing to a potential shift back in favor of the bulls. 
Make money without lifting your fingers: Start using a world-class auto trading solution
How To Buy Lucky Block – Guide, Tips & Insights | Learn 2 Trade
Note: Learn2.trade is not a financial advisor. Do your research before investing your funds in any financial asset, product, or event. We are not responsible for your investment results.
- Broker
- Min Deposit
- Score
- Visit Broker
- Award-winning Cryptocurrency trading platform
- $100 minimum deposit,
- FCA & Cysec regulated
- 20% welcome bonus of upto $10,000
- Minimum deposit $100
- Verify your account before the bonus is credited
- Fund Moneta Markets account with a minimum of $250
- Opt in using the form to claim your 50% deposit bonus
Learn to Trade
Never Miss A Trade Again

Signal Notification
Real-time signal notifications whenever a signal is opened, closes or Updated

Get Alerts
Immediate alerts to your email and mobile phone.

Entry Price Levels
Entry price level for every signal Just choose one of our Top Brokers in the list above to get all this free.


