
Lucky Block Price Forecast – Expert Analysis & Trading Tips | Learn 2 Trade – Expert Analysis & Trading Tips | Learn 2 Trade – November 14
The Lucky Block price forecast indicates a potential turnaround as buyers focus on recovering toward the critical $0.00002410 resistance level.
LBLOCKUSD Long-Term Trend: Bullish (Daily Chart)
Support Levels: $0.00001760, $0.00002100
Resistance Levels: $0.00002410, $0.00002600 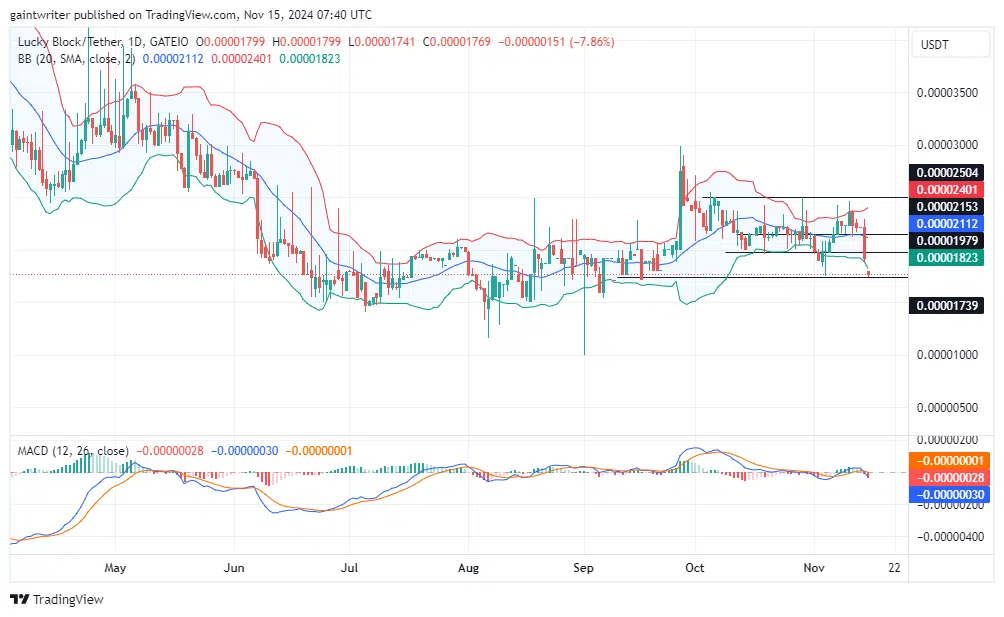
Lucky Block Price Forecast – Expert Analysis & Trading Tips | Learn 2 Trade – Expert Analysis & Trading Tips | Learn 2 Trade – LBLOCKUSD Outlook
Lucky Block Medium Term Trend: Bullish (4-hour Chart)
On the 4-hour chart, the market shows signs of consolidation as the Bollinger Bands narrow, restricting price movements. Despite this compression, buyers remain steady, preparing for a potential breakout. The $0.00001740 level serves as a focal point, with a breakout above this threshold possibly driving the price toward the $0.00002410 resistance zone. 
How To Buy Lucky Block
Note: Learn2.trade is not a financial advisor. Do your research before investing your funds in any financial asset, product, or event. We are not responsible for your investment results.


