Key Resistance Zones: 7000, 7100, 7200
Key Support Zones: 6100, 6000, 5900
Australia 200 (AU200AUD) Long-term Trends: Bullish
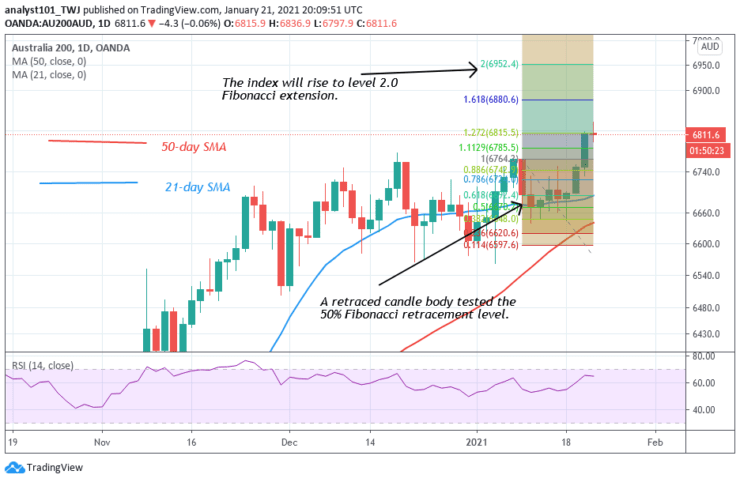
AU200AUD is in a sideways move below level 6800. The index has broken above level 6800. On January 20, a retraced candle body tested the 50% Fibonacci retracement level. The retracement indicates that the AU200AUD will rise to level 2.0 Fibonacci extension or the high of level 6952.40.
Daily Chart Indicators Reading:
The 21-day SMA and the 50-day SMA are sloping upward indicating the uptrend. The index has risen to level 64 of the Relative Strength Index period 14. This indicates that the market is in the uptrend zone and above the centerline 50.
Australia 200 (AU200AUD) Medium-term Trend: Bullish
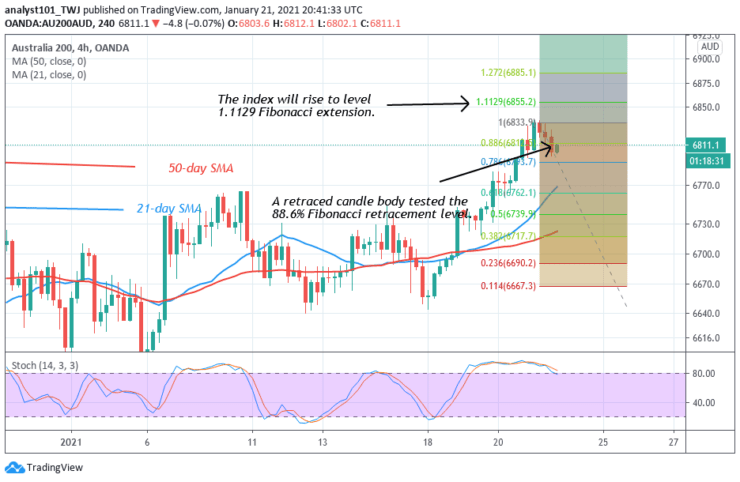
On the 4- hour chart, Australia 200 is making an upward move. On January 21 uptrend; a retraced candle body tested the 88.6% Fibonacci retracement level. The retracement indicates that the index will rise to level 1.1129 Fibonacci extension or the high of 6855.20.
4-hour Chart Indicators Reading
AU200AUD is above the 80% range of the daily stochastic. The index is in the overbought region of the market. The price may fall in the overbought region. The 21-day SMA and the 50-day SMA are sloping upward.
General Outlook for Australia 200 (AU200AUD)
Australia 200 is in an uptrend. The index is in the overbought region, according to the stochastic indicator. The market is said to be in a strong bullish momentum.
Note: Learn2.Trade is not a financial advisor. Do your research before investing your funds in any financial asset or presented product or event. We are not responsible for your investing result
- Broker
- Min Deposit
- Score
- Visit Broker

- Award-winning Cryptocurrency trading platform
- $100 minimum deposit,
- FCA & Cysec regulated

- 20% welcome bonus of upto $10,000
- Minimum deposit $100
- Verify your account before the bonus is credited
- Fund Moneta Markets account with a minimum of $250
- Opt in using the form to claim your 50% deposit bonus
Learn to Trade
Never Miss A Trade Again

Signal Notification
Real-time signal notifications whenever a signal is opened, closes or Updated

Get Alerts
Immediate alerts to your email and mobile phone.

Entry Price Levels
Entry price level for every signal Just choose one of our Top Brokers in the list above to get all this free.