Key Resistance Zones: 7000, 7100, 7200
Key Support Zones: 6100, 6000, 5900
Australia 200 (AU200AUD) Long-term Trends: Ranging
AU200AUD is in a sideways move below level 6800. The price has continued to consolidate below the resistance at level 6800. The market will resume an upward move if the resistance at level 6800 is breached. The index will resume a downward move if it faces rejection at the overhead resistance.
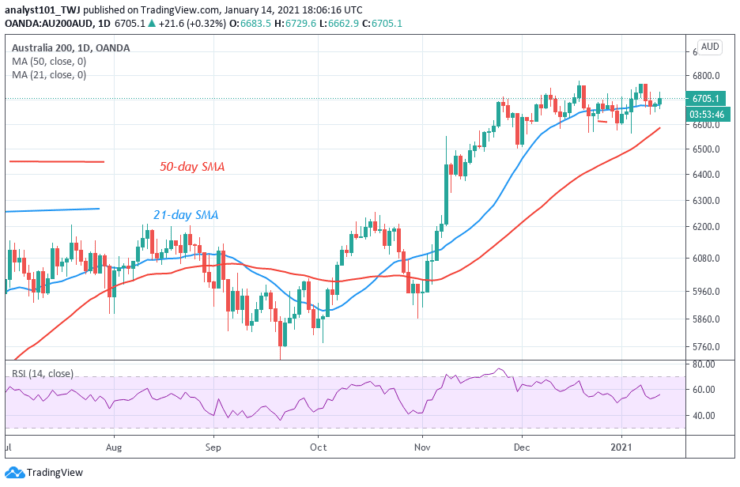
Daily Chart Indicators Reading:
The 21-day SMA and the 50-day SMA are sloping upward indicating the uptrend. The index has risen to level 54 of the Relative Strength Index period 14. This indicates that the market is in the uptrend zone and above the centerline 50.
Australia 200 (AU200AUD) Medium-term Trend: Bearish
On the 4- hour chart, Australia 200 is in a downward move. At the rejection of level 6760, the market dropped to level 6640 and resumed upward. The price corrected upward but faced another rejection at level 6720. The market is likely to continue its downward move.
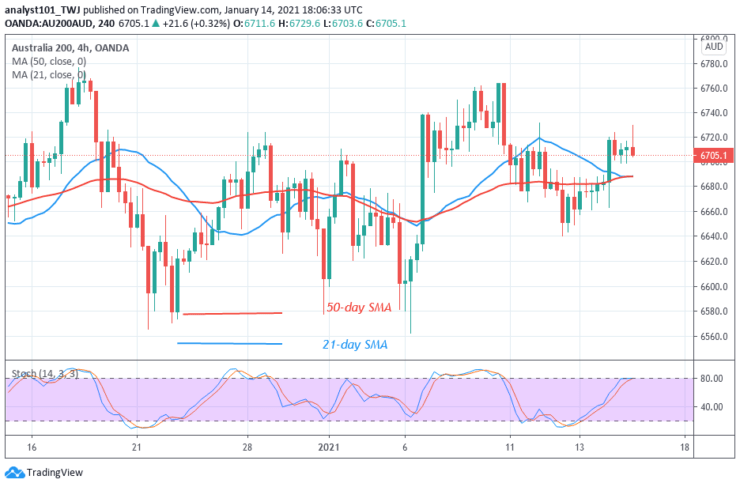
4-hour Chart Indicators Reading
AU200AUD is above the 80% range of the daily stochastic. The index is in the overbought region of the market. Sellers may emerge to push prices down. The 21-day SMA and the 50-day SMA are sloping sideways move.
General Outlook for Australia 200 (AU200AUD)
Australia 200 is making a downward move. The market has remained in the overbought region since November. The downtrend will resume if the price breaks below the SMAs.
Note: Learn2.Trade is not a financial advisor. Do your research before investing your funds in any financial asset or presented product or event. We are not responsible for your investing result
- Broker
- Min Deposit
- Score
- Visit Broker

- Award-winning Cryptocurrency trading platform
- $100 minimum deposit,
- FCA & Cysec regulated

- 20% welcome bonus of upto $10,000
- Minimum deposit $100
- Verify your account before the bonus is credited
- Fund Moneta Markets account with a minimum of $250
- Opt in using the form to claim your 50% deposit bonus
Learn to Trade
Never Miss A Trade Again

Signal Notification
Real-time signal notifications whenever a signal is opened, closes or Updated

Get Alerts
Immediate alerts to your email and mobile phone.

Entry Price Levels
Entry price level for every signal Just choose one of our Top Brokers in the list above to get all this free.