Key Resistance Zones: 7000, 7100, 7200
Key Support Zones: 6100, 6000, 5900
Australia 200 (AU200AUD) Long-term Trends: Bullish
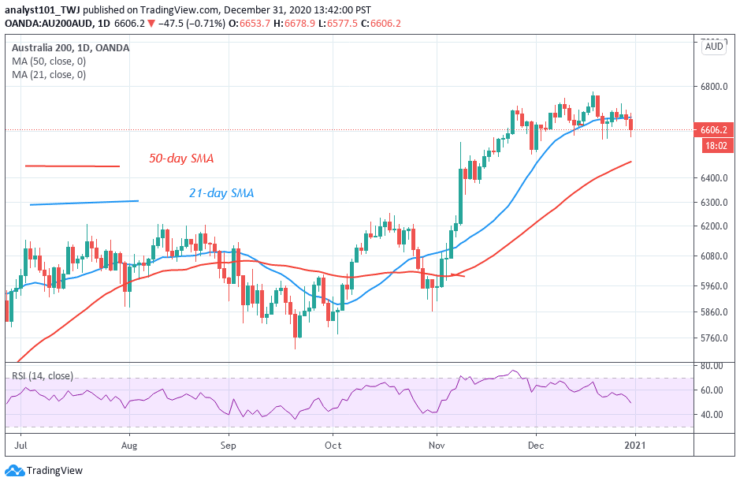
Australia 200 is in a sideways move below level 6300. The index has been fluctuating between levels 6600 and 6800. Australia 200 is likely to fall as it reaches the overbought region of the market.
Daily Chart Indicators Reading:
The 21-day SMA and the 50-day SMA are sloping upward indicating the uptrend. The index has fallen to level 54 of the Relative Strength Index period 14. This indicates that the market is in the uptrend zone and above the centerline 50.
Australia 200 (AU200AUD) Medium-term Trend: Bullish
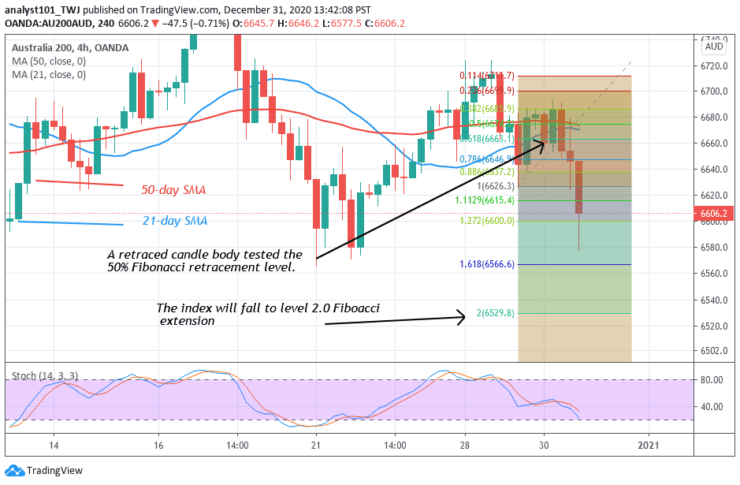
On the 4- hour chart, Australia 200 is in an upward move. The upward move is facing resistance at level 6700. The index is retracing from the recent high. A retraced candle body tested the 50% Fibonacci retracement level. The index will fall to level 2.0 Fibonacci extension. That is the low of level 6529.80.
4-hour Chart Indicators Reading
AU200AUD is above the 40% range of the daily stochastic. The index is approaching the oversold region. The 21-day SMA and the 50-day SMA are sloping upward indicating the current uptrend.
General Outlook for Australia 200 (AU200AUD)
Australia 200 is making a downward move. The index is falling after rejection at level 6680. According to the Fibonacci tool, the market will fall to level 6529.80.
Note: Learn2.Trade is not a financial advisor. Do your research before investing your funds in any financial asset or presented product or event. We are not responsible for your investing results
- Broker
- Min Deposit
- Score
- Visit Broker

- Award-winning Cryptocurrency trading platform
- $100 minimum deposit,
- FCA & Cysec regulated

- 20% welcome bonus of upto $10,000
- Minimum deposit $100
- Verify your account before the bonus is credited
- Fund Moneta Markets account with a minimum of $250
- Opt in using the form to claim your 50% deposit bonus
Learn to Trade
Never Miss A Trade Again

Signal Notification
Real-time signal notifications whenever a signal is opened, closes or Updated

Get Alerts
Immediate alerts to your email and mobile phone.

Entry Price Levels
Entry price level for every signal Just choose one of our Top Brokers in the list above to get all this free.