The general stock market continues to feel the impact of confusion caused by U.S. trade tariffs. This negative influence has extended into the ASX 200 market. Let’s examine this market more closely below.
Key Price Levels
Resistance Levels: 8,000, 8,500, 9,000
Support Levels: 7,500, 7,200, 7,000
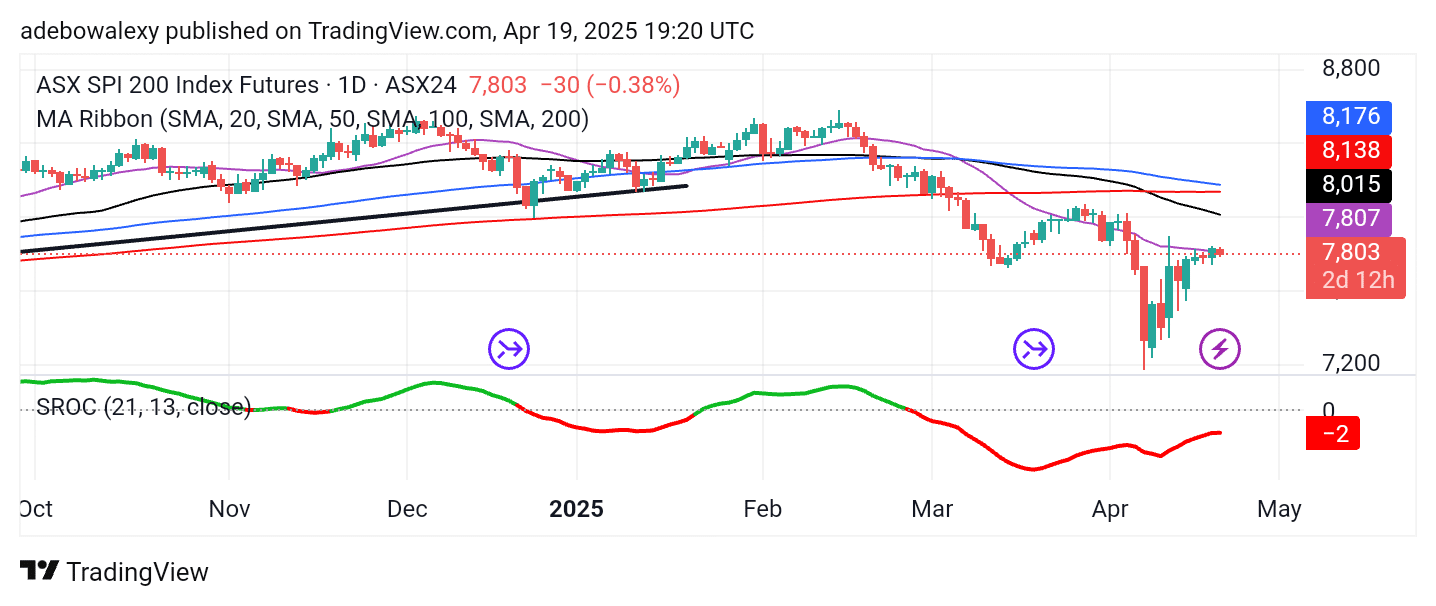
Australia 200 Hits a Stop at the 20-Day MA
The ASX 200 market has been steadily retracing upward toward the 20-day Moving Average (MA) curve. However, it appears that upside momentum has gradually slowed as price action approaches the MA.
The latest price candle on the daily chart is red, indicating a downward rebound. As a result, price action has moved back below all the MA lines on the chart. The Stochastic Rate of Change (SROC) line remains below the equilibrium level but is slightly upward, mirroring the recent mild bullish movement in price action.
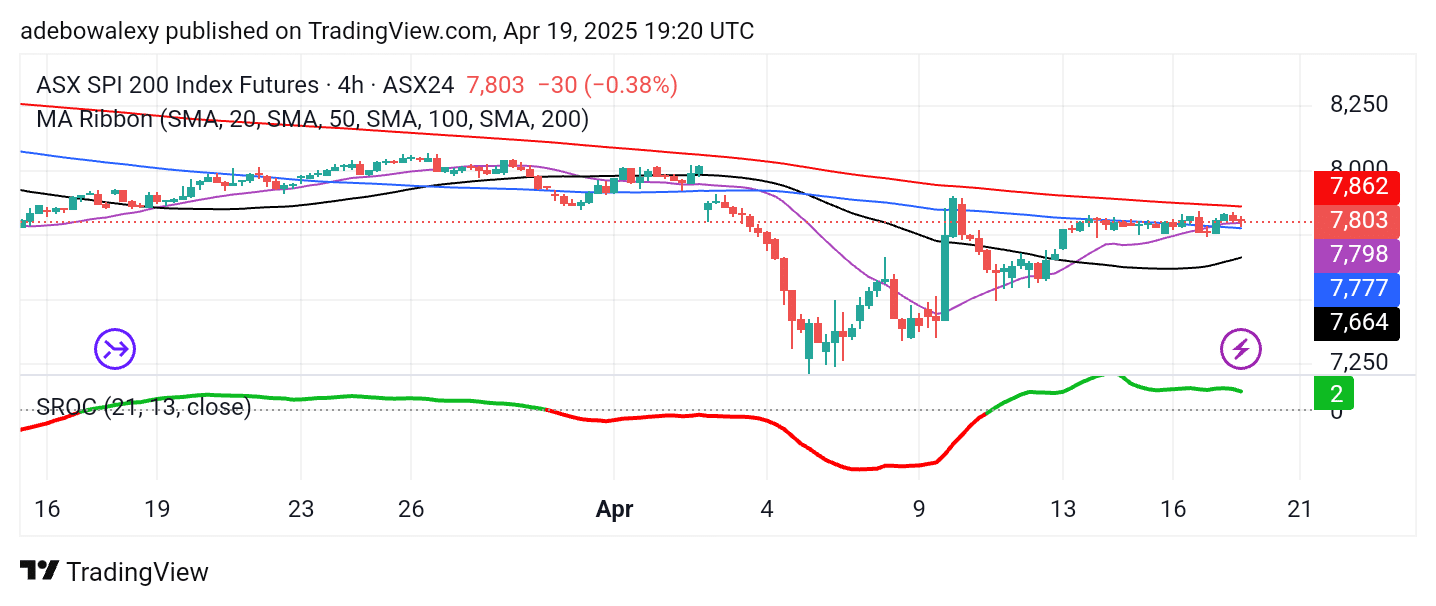
ASX 200 Holds Above 7,800
Despite bearish momentum in recent sessions on the Australia 200 4-hour chart, price action remains above the 7,800 level. The latest price candle shows the market trading precisely at 7,803, just above the 20-, 50-, and 100-day MA lines.
Meanwhile, the SROC indicator line continues to move sideways above the equilibrium level. The line remains green, signaling that bullish forces still dominate. At this point, if support around the 20-day MA holds, price action may advance toward the 8,000 mark.
Make money without lifting your fingers: Start trading smarter today
- Broker
- Min Deposit
- Score
- Visit Broker

- Award-winning Cryptocurrency trading platform
- $100 minimum deposit,
- FCA & Cysec regulated

- 20% welcome bonus of upto $10,000
- Minimum deposit $100
- Verify your account before the bonus is credited
- Fund Moneta Markets account with a minimum of $250
- Opt in using the form to claim your 50% deposit bonus
Learn to Trade
Never Miss A Trade Again

Signal Notification
Real-time signal notifications whenever a signal is opened, closes or Updated

Get Alerts
Immediate alerts to your email and mobile phone.

Entry Price Levels
Entry price level for every signal Just choose one of our Top Brokers in the list above to get all this free.