

Similar to other stock indices, the Australia 200 market has made a smooth turn toward lower price levels. At present, the market appears to have passed a bearish test, with price action looking poised to proceed downward. More details about the likely market direction are provided below.
Key Price Levels
Resistance Levels: 8,700, 9,100, 9,500
Support Levels: 8,300, 7,900, 7,500
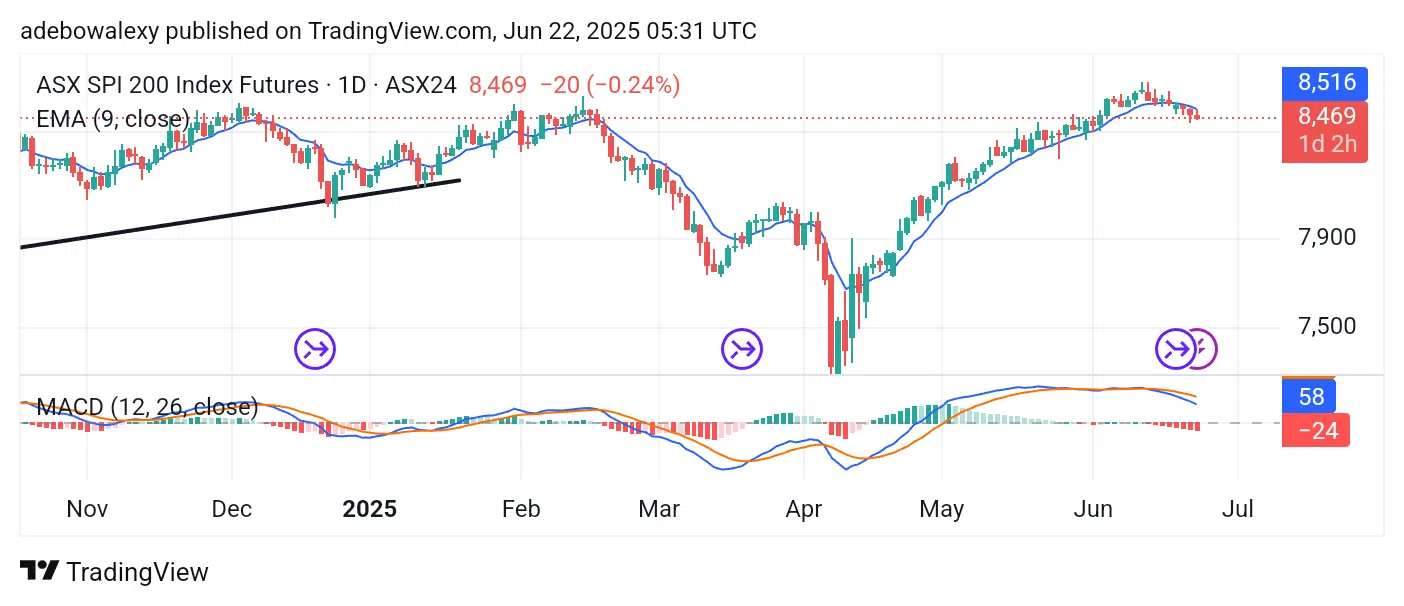
Australia 200 Eyes 8,300 Baseline
Price activity in the ASX 200 market has shown a minimal retracement to lower levels throughout the past week. At this point, the market is now trading below the 9-day Exponential Moving Average (EMA) curve, which serves as a significant technical marker.
Additionally, the price candle corresponding to the ongoing session is red and sits below the 9-day EMA line. Similarly, the lines of the Moving Average Convergence Divergence (MACD) indicator are above the equilibrium level but are currently descending toward it, hinting at the potential for further price declines.

ASX 200 Stays Consistently Bearish
Even on the Australia 200 4-hour chart, it can be seen that price action has remained below the 9-day EMA line. This chart reveals that the downward retracement began effectively when price action tested resistance at the 8,800 level. Since then, prices have
Consistently stayed below the EMA line. Likewise, the MACD indicator lines continue to descend further below the equilibrium level. Therefore, traders can target the 8,400 price level—barring any contrary economic developments that may influence market direction.
Make money without lifting your fingers: Start trading smarter today


