Key Resistance Zones: 7000, 7100, 7200
Key Support Zones: 6100, 6000, 5900
Australia 200 (AU200AUD) Long-term Trend: Bullish
Australia 200 is currently in ascending channel. The upward move is currently facing resistance at level 5500. The market has been falling after being resisted at level 5500. The index has fallen to the lower price range and the downward move is being exhausted.
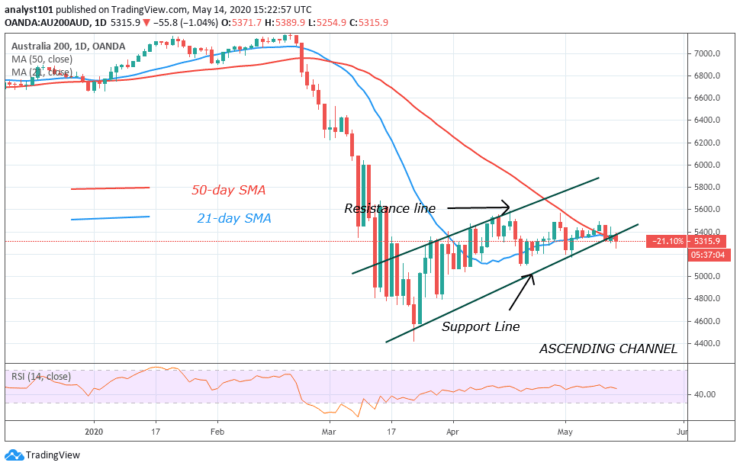
Daily Chart Indicators Reading:
A bearish candlestick has fallen to the support of 21-day SMA. The moving averages are at the point of a bullish crossover. The index is at level 47 of the Relative Strength Index period 14. This indicates that the market is in the downtrend zone.
Australia 200 (AU200AUD) Medium-term Trend: Bullish
On the 4- hour chart, the index is currently in an ascending channel. Australia 200 has fallen and broken below the lower price range. An upward movement is expected as it has fallen below the lower price range.
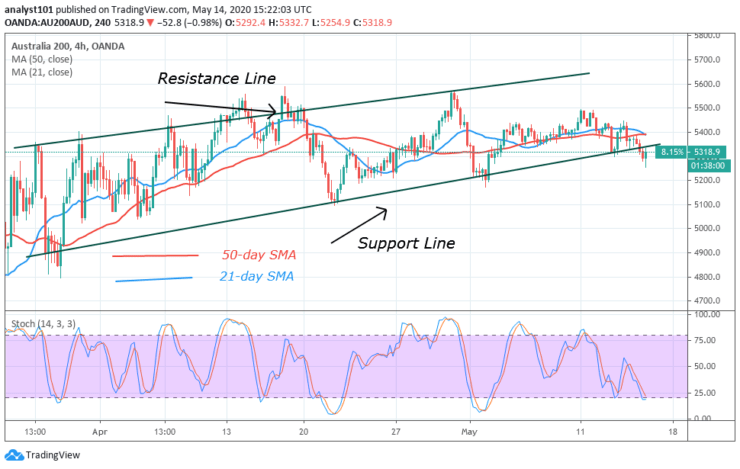
4-hour Chart Indicators Reading
AU200AUD is below 20% range of the daily stochastic. This implies that the market has reached the oversold region. We expect buyers to emerge to push the index upward. The 21-day SMA and the 50-day SMA are sloping upward.
General Outlook for Australia 200 (AU200AUD)
Australia 200 has been trading below the resistance at 5500. On the upside, if the current resistance is broken, the price will rally above level 5600. Since April the bulls are yet break above the resistance and price has not been sustained above it.
Note: Learn2.Trade is not a financial advisor. Do your research before investing your funds in any financial asset or presented product or event. We are not responsible for your investing results
- Broker
- Min Deposit
- Score
- Visit Broker

- Award-winning Cryptocurrency trading platform
- $100 minimum deposit,
- FCA & Cysec regulated

- 20% welcome bonus of upto $10,000
- Minimum deposit $100
- Verify your account before the bonus is credited
- Fund Moneta Markets account with a minimum of $250
- Opt in using the form to claim your 50% deposit bonus
Learn to Trade
Never Miss A Trade Again

Signal Notification
Real-time signal notifications whenever a signal is opened, closes or Updated

Get Alerts
Immediate alerts to your email and mobile phone.

Entry Price Levels
Entry price level for every signal Just choose one of our Top Brokers in the list above to get all this free.