Buyers’ Pressure is increasing
AUDUSD Price Analysis – 06 September
AUDUSD may fall to the $0.63, $0.62, and $0.61 support levels if sellers are successful in holding the $0.64 resistance level. When buyers get more momentum, the resistance level of $0.64 might be broken higher, and the price might then increase as a result of the upward momentum to levels of $0.65 and $0.66.
AUD/USD Market
Key levels:
Resistance levels: $0.64, $0.65, $0.66
Support levels: $0.63, $0.62, $0.61
AUDUSD Long-term Trend: Bearish
AUDUSD is on a bearish movement in daily chart. The currency pair is retesting the support level of $0.63 at the moment. On June 16, the currency pair attempted to cross the $0.68 resistance level. Two tests have been conducted on the aforementioned level. A second trade took place on July 13. The previously noted significant resistance level, which the price bounced off, is still in place. A powerful daily bearish candle that challenged the $0.63 level by crossing over the $0.66 support level created a double-top chart pattern.
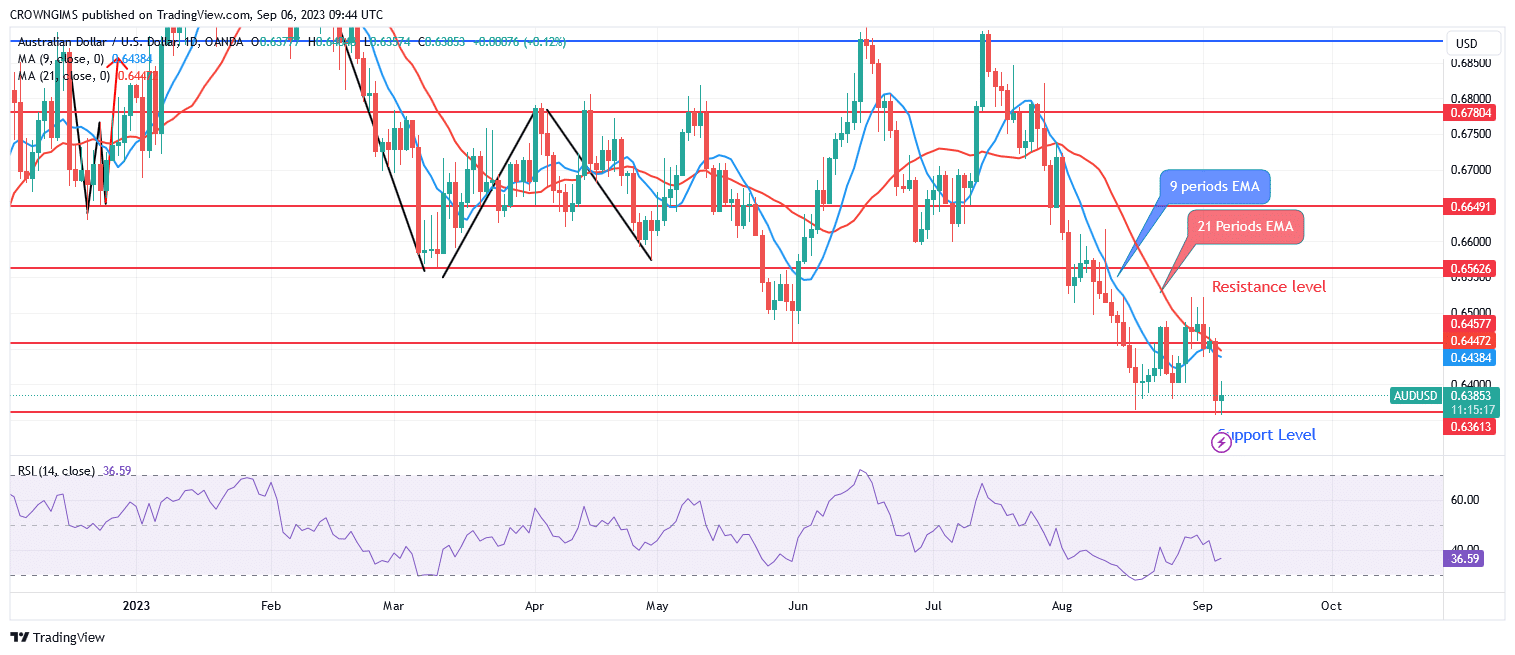
AUDUSD currency pair is currently trading below the 9-period and 21-period exponential moving averages. The Relative Strength Index’s period 14 signal lines are pointing downward at levels of 38. AUDUSD may fall to the $0.63, $0.62, and $0.61 support levels if sellers are successful in holding the $0.64 resistance level. When buyers get more momentum, the resistance level of $0.64 might be broken higher, and the price might then increase as a result of the upward momentum to levels of $0.65 and $0.66.
AUDUSD medium-term Trend: Bullish
AUDUSD is bullish on the 4-hour chart. The downward trend forced the price to attempt the $0.64 barrier level on July 27. It pulled back while making an effort to keep the mentioned support. The following day, as a result of increased seller pressure, the price dropped to a low of $0.63. The double bottom chart pattern was created as a result of this situation. If further bullish candles form, the price will likely rise further, maybe reaching its high of $0.65.
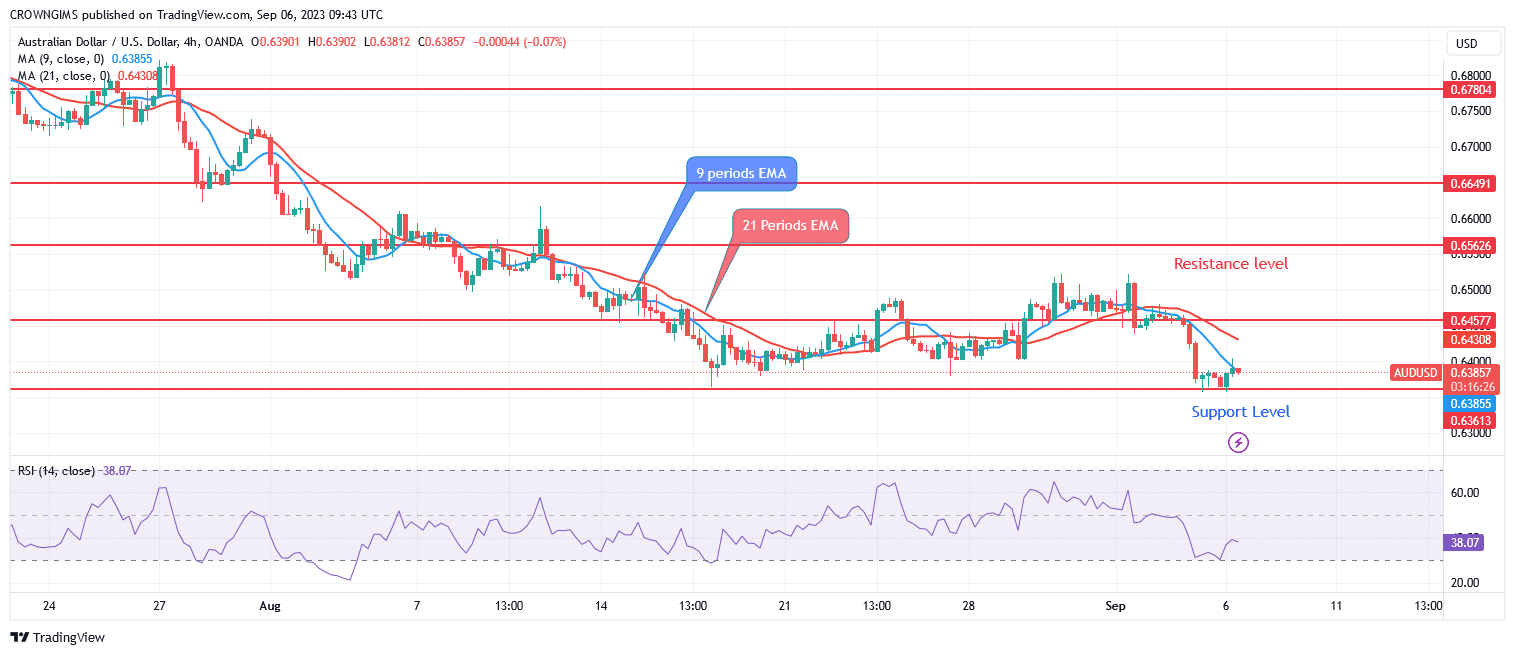
A bullish market is currently being indicated by the price’s small overperformance of the 9-period and 21-period exponential moving averages. A buy signal is indicated by rising signal lines and the Relative Strength Index period 14 at 41 levels.
You can purchase Lucky Block – Guide, Tips & Insights | Learn 2 Trade here. Buy LBLOCK
- Broker
- Min Deposit
- Score
- Visit Broker

- Award-winning Cryptocurrency trading platform
- $100 minimum deposit,
- FCA & Cysec regulated

- 20% welcome bonus of upto $10,000
- Minimum deposit $100
- Verify your account before the bonus is credited
- Fund Moneta Markets account with a minimum of $250
- Opt in using the form to claim your 50% deposit bonus
Learn to Trade
Never Miss A Trade Again

Signal Notification
Real-time signal notifications whenever a signal is opened, closes or Updated

Get Alerts
Immediate alerts to your email and mobile phone.

Entry Price Levels
Entry price level for every signal Just choose one of our Top Brokers in the list above to get all this free.