AUDUSD market under buyers’ pressure
AUDUSD Price Analysis – 04 September
Customers may be able to raise AUDUSD to roughly $0.70 or possibly $0.71 if they are persistent enough to get over the $0.69 barrier. Prices may fall to the $0.67 and $0.66 support levels if sellers are successful in pushing the price below the $0.68 support level. When the currency pair clears the Hull Suite forex signals indicator, the market is considered bullish.
Key levels:
Resistance levels: $0.69, $0.70, $0.71
Support levels: $0.68, $0.67, $0.66
AUDUSD Long-term Trend: Bullish
The value of the AUDUSD is increasing on the daily chart. A large bullish candle that appeared on August 5 signaled the beginning of a bullish trend for the currency pair. The price rose by $0.66 as a result of the bulls’ efforts. When sales started to decline, the price had gone up from the initial estimated amount to $0.67. At $0.67, the AUDUSD price is above the support level. Right now, the $0.67 barrier is being broken. The state of the market supports the bulls’ rally call from yesterday to $0.69 level.
 .69 Level" width="580" height="259" data-lazy-src="https://learn2.trade/wp-content/uploads/2024/09/Daily-10-1024x458.png"/>
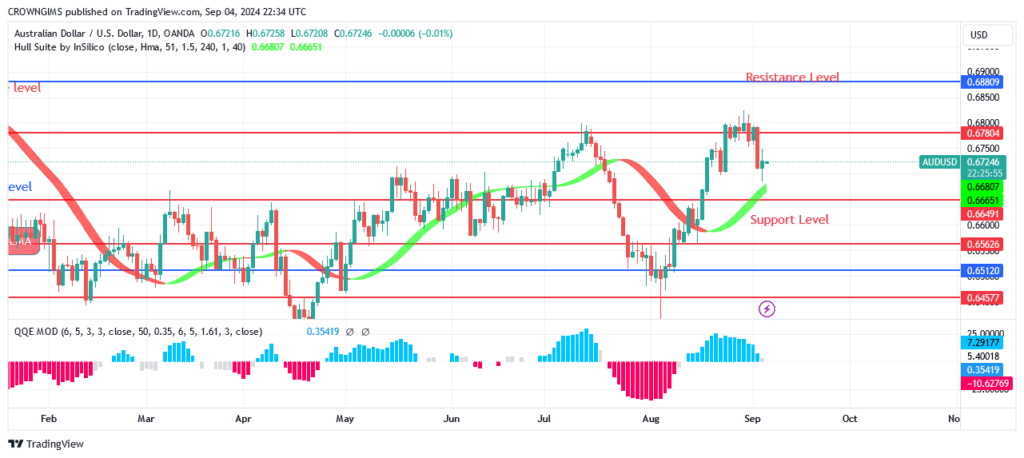
When the blue QQE MOD indicator histogram is above the zero level, a buy forex signal is shown. Customers may be able to raise the price to roughly $0.70 or possibly $0.71 if they are persistent enough to get over the $0.69 barrier. Prices may fall to the $0.67 and $0.66 support levels if sellers are successful in pushing the price below the $0.68 support level. When the currency pair clears the Hull Suite forex signals indicator, the market is considered bullish.
AUDUSD medium-term Trend: Bullish
The 4-hour chart of the Australian dollar indicates an upward trend. For more than a week, the $0.66 barrier level limited the movement of the currency pair. The price range was $0.664 to $0.65. Further bullish candles burned as the price began to soar above the dynamic barrier level. The 4-hour candle that closed at $0.68 last week appears promising on the chart. The increasing tendency may continue if the prior ceiling is surpassed.
.69 Level" width="580" height="259" data-lazy-src="https://learn2.trade/wp-content/uploads/2024/09/4-hours-10-1024x458.png"/>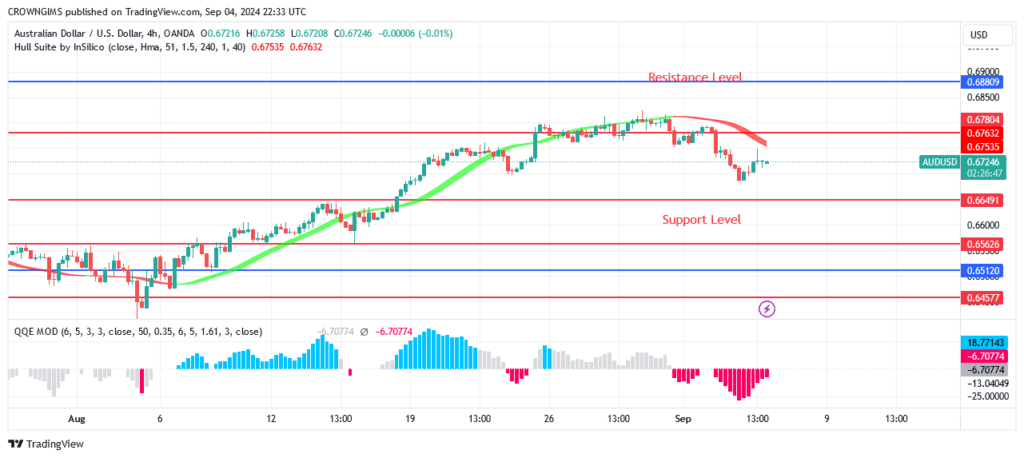
You can purchase Lucky Block – Guide, Tips & Insights | Learn 2 Trade here. Buy LBLOCK
- Broker
- Min Deposit
- Score
- Visit Broker

- Award-winning Cryptocurrency trading platform
- $100 minimum deposit,
- FCA & Cysec regulated

- 20% welcome bonus of upto $10,000
- Minimum deposit $100
- Verify your account before the bonus is credited
- Fund Moneta Markets account with a minimum of $250
- Opt in using the form to claim your 50% deposit bonus
Learn to Trade
Never Miss A Trade Again

Signal Notification
Real-time signal notifications whenever a signal is opened, closes or Updated

Get Alerts
Immediate alerts to your email and mobile phone.

Entry Price Levels
Entry price level for every signal Just choose one of our Top Brokers in the list above to get all this free.