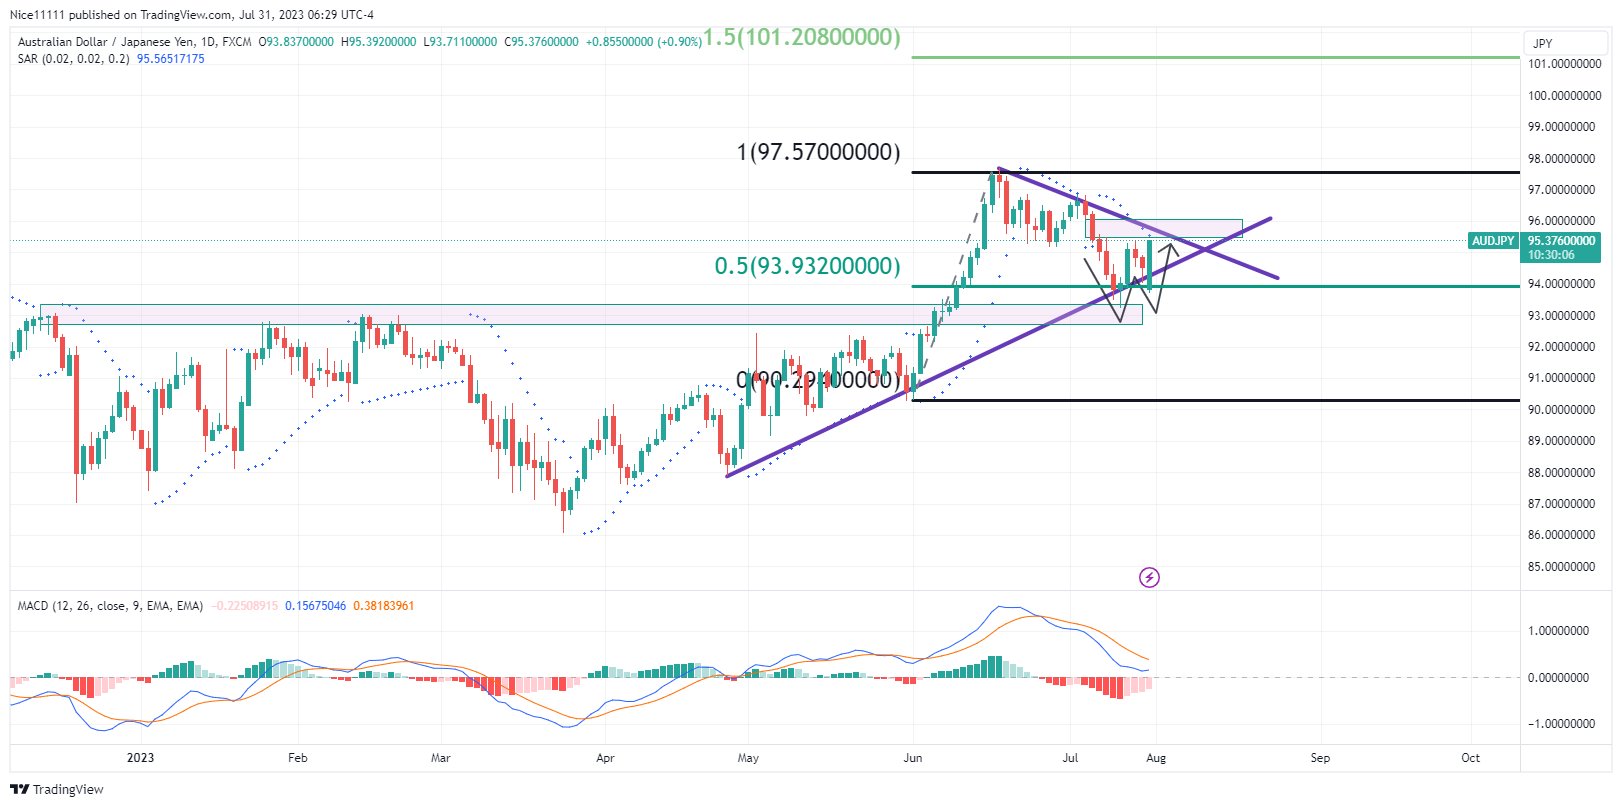
AUDJPY has recently displayed a noteworthy development, forming a double-bottom bullish reversal pattern as it tested the previous resistance zone at 93.0. This resistance level lies within the discount region of the last bullish swing on the daily chart.
Despite the double-bottom bullish pattern, it’s essential to note that the previous bearish order block at 96.0 remains intact, keeping the market structure bearish. Both the MACD (Moving Averages Convergence and Divergence) indicator and the Parabolic SAR (Stop and Reverse) continue to indicate bearishness on the daily chart.
When observing the lower timeframe, we find a contrasting trend. The MACD on the 4-hour chart shows a bullish signal due to the presence of multiple large bullish candles. The current resistance zone at 95.0 is now under threat as the price rises rapidly on the lower timeframe. To confirm a full-fledged bullish trend, a decisive sweep above the high of 97.0 would be necessary
Trade on MT4 with Leverage up to 1:500! Trade on MT4 with Leverage up to 1:500!
X
We use cookies to ensure that we give you the best experience on our website. If you continue to use this site we will assume that you are happy with it.

 AUDJPY Short-Term Trend: Bullish


