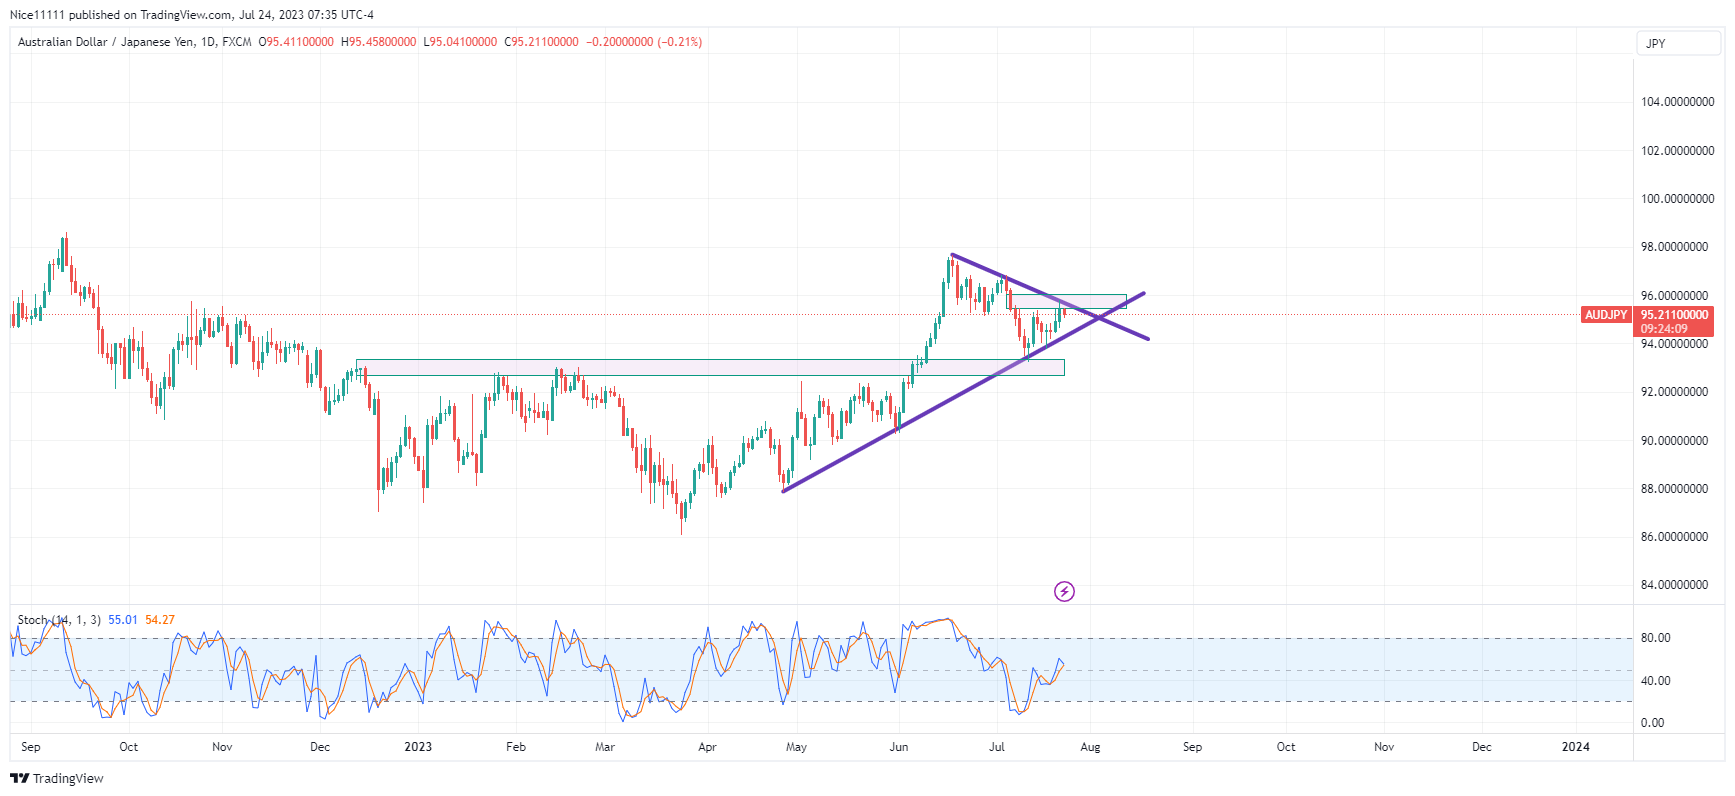
The AUDJPY currency pair is currently showing adherence to a bearish trendline, leading to a test of a significant demand zone. Notably, a double bottom pattern formed after the demand level was tested.
Furthermore, the swing low of the demand level aligns with a bullish trendline, resulting in a critical convergence point. As a result, market participants are closely monitoring the situation, anticipating an imminent breakout that will determine the next direction for the pair.
An analysis of the Stochastic indicator revealed that the market was oversold during the test of the demand level in July, indicating a potential reversal. Currently, the price is gravitating towards the fair value gap at 95.500.
To further set the stage for an upcoming breakout, the price action has formed a symmetrical triangle pattern. Such patterns often serve as signals for potential significant price movements.
AUDJPY Short-Term Trend: Bearish
On the 4-hour chart, the price is displaying a bullish trend, though it has become overbought according to the Stochastic indicator. As a possible scenario, the price might retrace from the resistance trendline to the supporting trendline before the anticipated breakout occurs.
Trade on MT4 with Leverage up to 1:500! Trade on MT4 with Leverage up to 1:500!
X
We use cookies to ensure that we give you the best experience on our website. If you continue to use this site we will assume that you are happy with it.

 AUDJPY Short-Term Trend: Bearish


