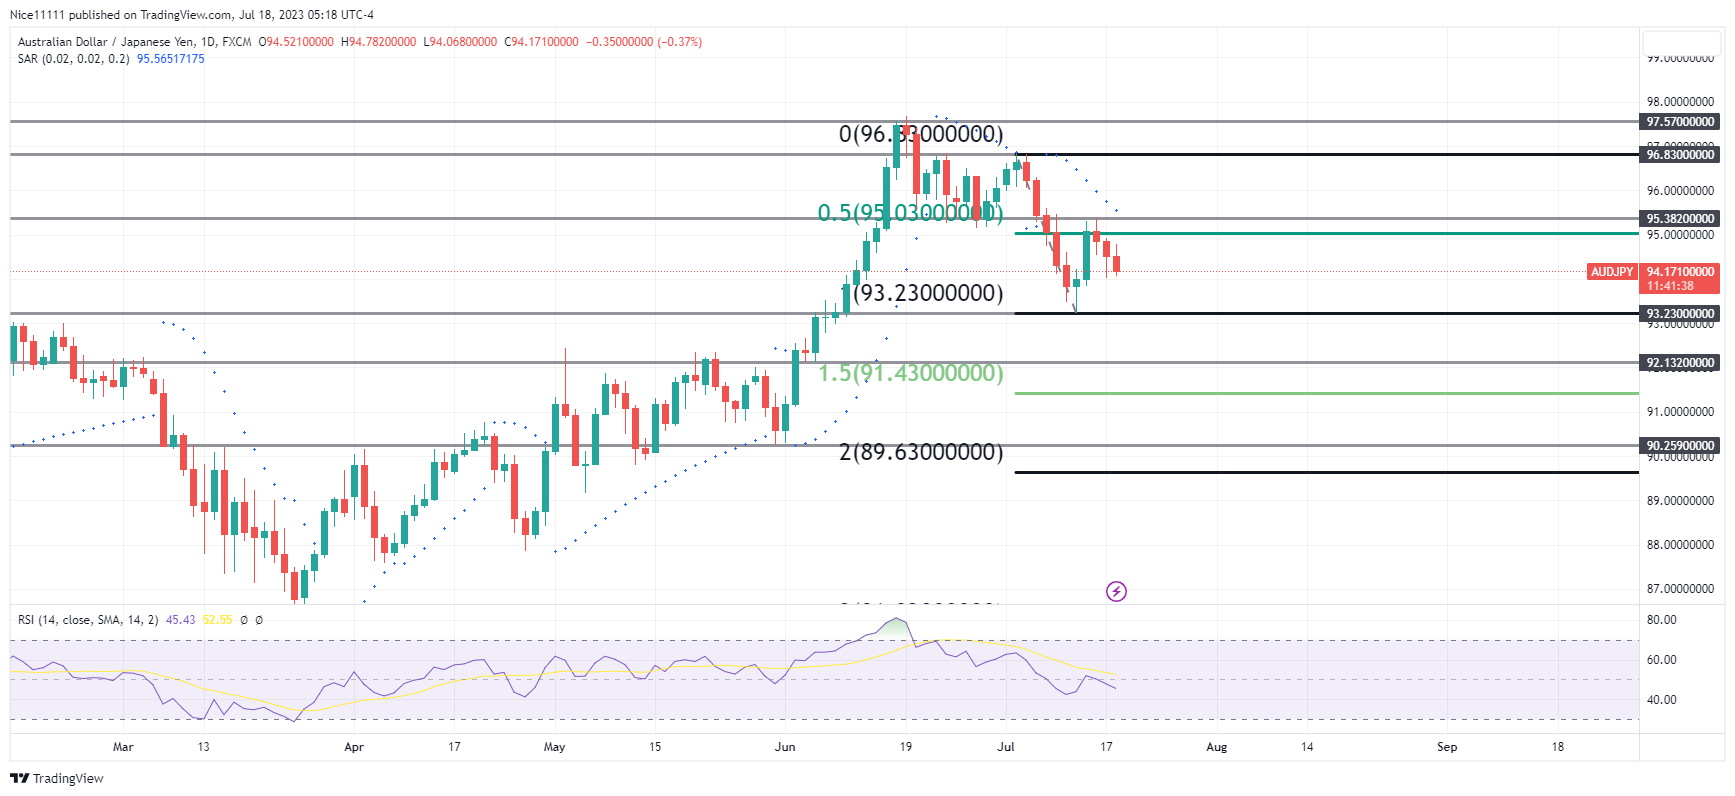
AUDJPY has established a new selling trend, as evidenced by five consecutive days of down-close candles. This bearish swing emerged following the test of the resistance level at 97.570 in June, indicating a significant turning point for the market. The Relative Strength Index (RSI) further confirmed the overbought condition present at this key level, signalling a potential shift in market sentiment.
The Parabolic SAR (Stop and Reverse) indicator offers valuable insights into the current price movement of AUDJPY. Clearly depicting a declining price trend, the SAR points hover above the daily candle, suggesting a bearish bias.
Notably, the recent market behaviour displayed a pullback to the equilibrium of the trading range before resuming the ongoing sell-off. As the selling pressure regained momentum, the price is currently heading towards a significant support level of 93.230.
AUDJPY Short-term Trend: Bearish
The bearish sentiment persists, as evident on both the 4-hour chart and the daily chart, with the RSI indicating bearishness. Additionally, a well-defined bearish trendline on the 4-hour chart seems to serve as a reliable anchor for shorts, providing a potential opportunity for traders looking to capitalize on the current downtrend.
Trade on MT4 with Leverage up to 1:500! Trade on MT4 with Leverage up to 1:500!
X
We use cookies to ensure that we give you the best experience on our website. If you continue to use this site we will assume that you are happy with it.

 AUDJPY Short-term Trend: Bearish


