Don’t invest unless you’re prepared to lose all the money you invest. This is a high-risk investment and you are unlikely to be protected if something goes wrong. Take 2 minutes to learn more
Market Analysis – September 6
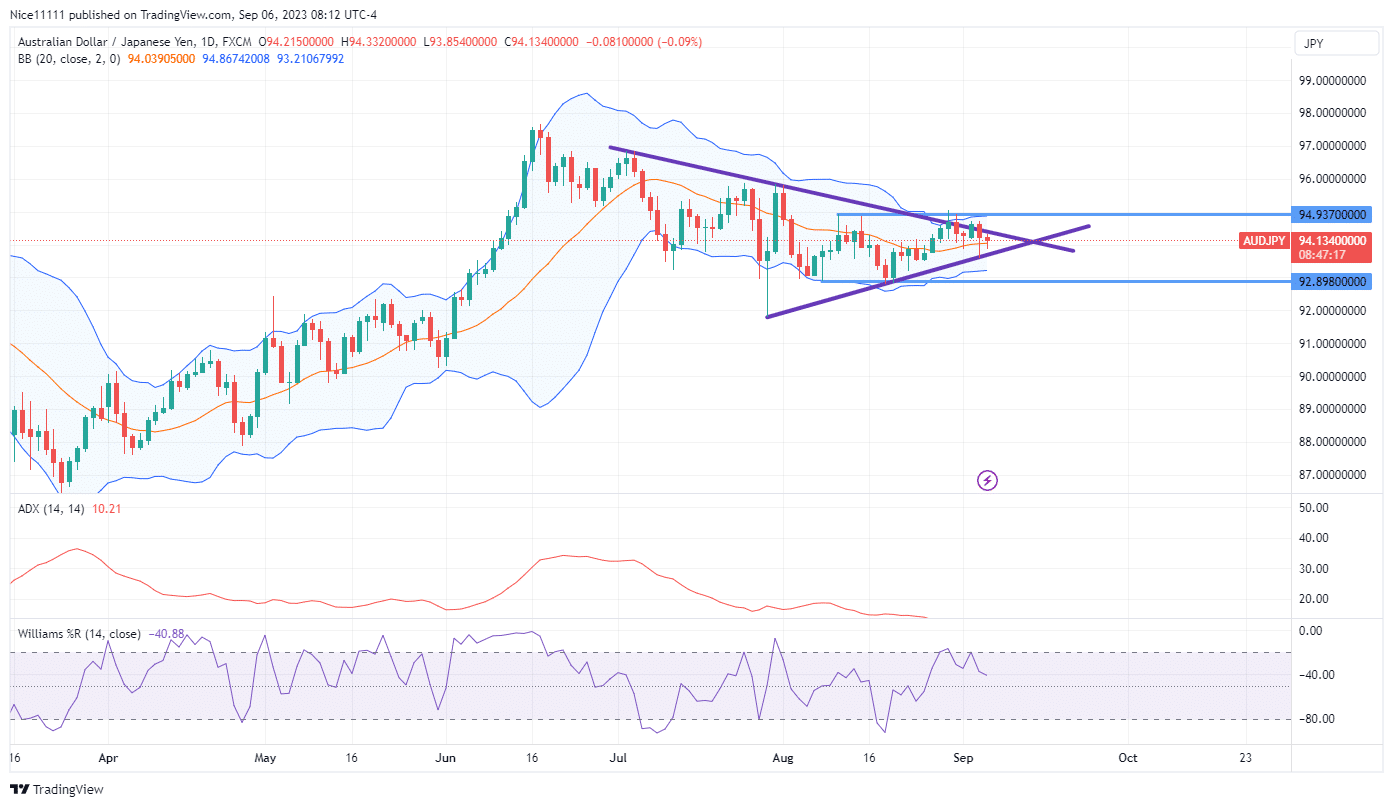
AUDJPY prepares for a breakout. The market experienced a strong bullish trend during the early part of June. The slope of the ADX (Average Directional Index) was positive during the period, revealing the stability of the market uptrend. Only a single down-close candle formed until the nineteenth due to the daunting strength of the buyers. The daily candles rested above the Moving Average line of Period Twenty, which rested in between the Bollinger Bands.
AUDJPY Key Levels
Demand Levels: 93.940, 96.700, 97.560
Support Levels: 92.900, 91.800, 90.300

AUDJPY Long-Term Trend: Bearish
A swing high formed at 97.0 after the Williams Percent Range signaled the exhaustion of the buyers. The daily candles slightly pushed above the upper band of the Bollinger to reveal the market was oversold. Shortly after, a decline in the price was first observed with a daily close candle.
i
Furthermore, the market structure shift also signaled the initiation of a fall in price. The market easily took out the swing low established on the 22nd of June. Clearly, the market was on a downward trend with the fall in the price below the Moving Average between the Bollinger Bands.
I
However, the Bulls have fought aggressively to prevent the price crash. This has led to a symmetrical triangle pattern on the daily chart. Unsurprisingly, the tussle between the buyers and the sellers affected the ADX. The Average Directional Index slope turned negative. The downward trend is very weak.

AUDJPY Short-Term Trend: Ranging
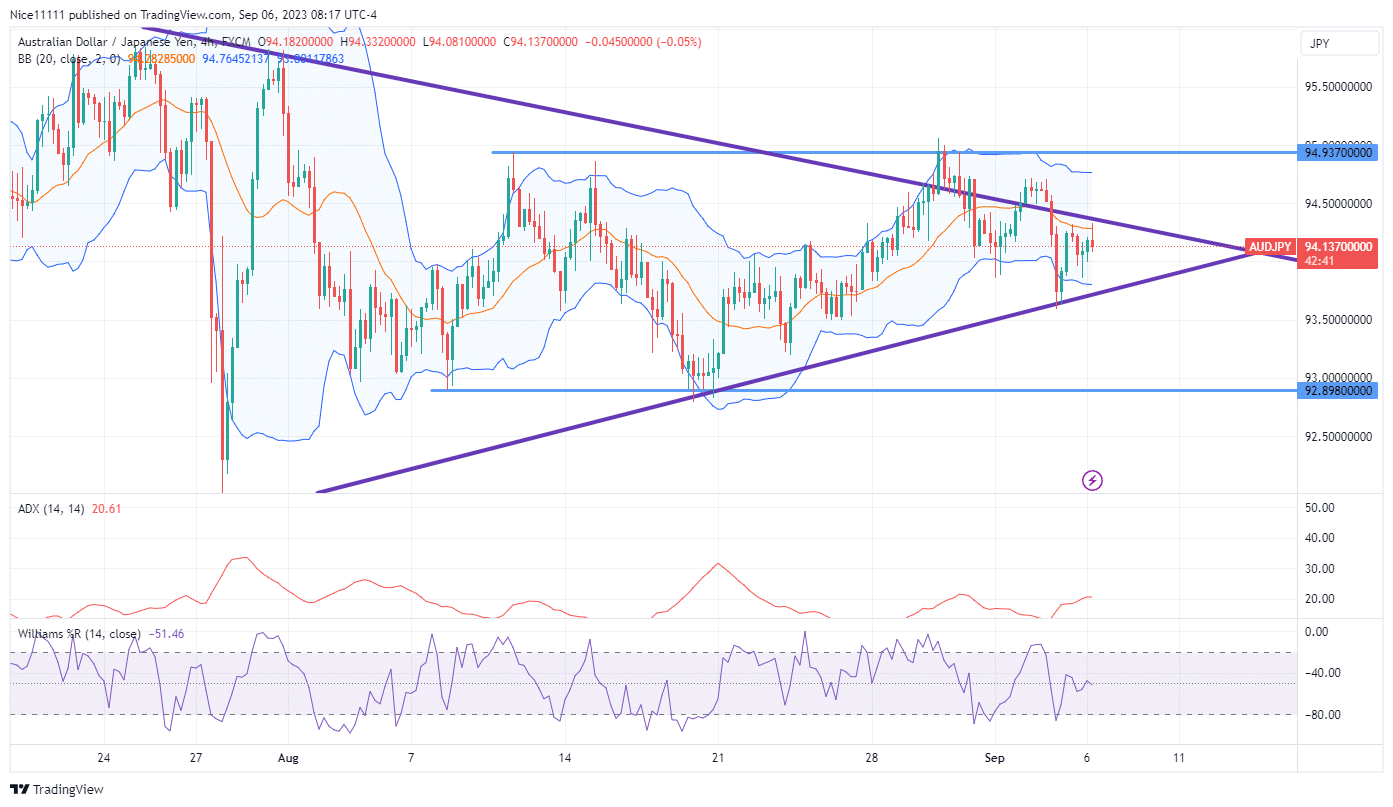
AUDJPY price is stuck between the resistance level of 94.940 and the support level of 92.900. The price is currently at equilibrium within the range. This is seen on the Williams Percent Range as the Oscillator lies in the middle. The 4-hour chart has established a bearish shift in market structure. This is likely going to send the price to the lower end at 92.900.
I
Do you want to take your trading to the next level? Join the best platform for that here
- Broker
- Min Deposit
- Score
- Visit Broker
- Award-winning Cryptocurrency trading platform
- $100 minimum deposit,
- FCA & Cysec regulated
9.8
- 20% welcome bonus of upto $10,000
- Minimum deposit $100
- Verify your account before the bonus is credited
9
- Fund Moneta Markets account with a minimum of $250
- Opt in using the form to claim your 50% deposit bonus
9
Learn to Trade
Never Miss A Trade Again

step 1
Signal Notification
Real-time signal notifications whenever a signal is opened, closes or Updated

step 2
Get Alerts
Immediate alerts to your email and mobile phone.

step 3
Entry Price Levels
Entry price level for every signal Just choose one of our Top Brokers in the list above to get all this free.


