

Lucky Block Price Forecast – Expert Analysis & Trading Tips | Learn 2 Trade – Expert Analysis & Trading Tips | Learn 2 Trade: September 8
The Lucky Block price forecast is for the market to rebuild another rally from its most trusted demand zone at $0.0000880.
LBLOCK/USD Long-Term Trend: Bullish (1-Day Chart)
Key Levels-
Supply Zones: $0.0001990, $0.0001420, $0.0001100
Demand Zones: $0.0000880, $0.0000720, $0.0000650
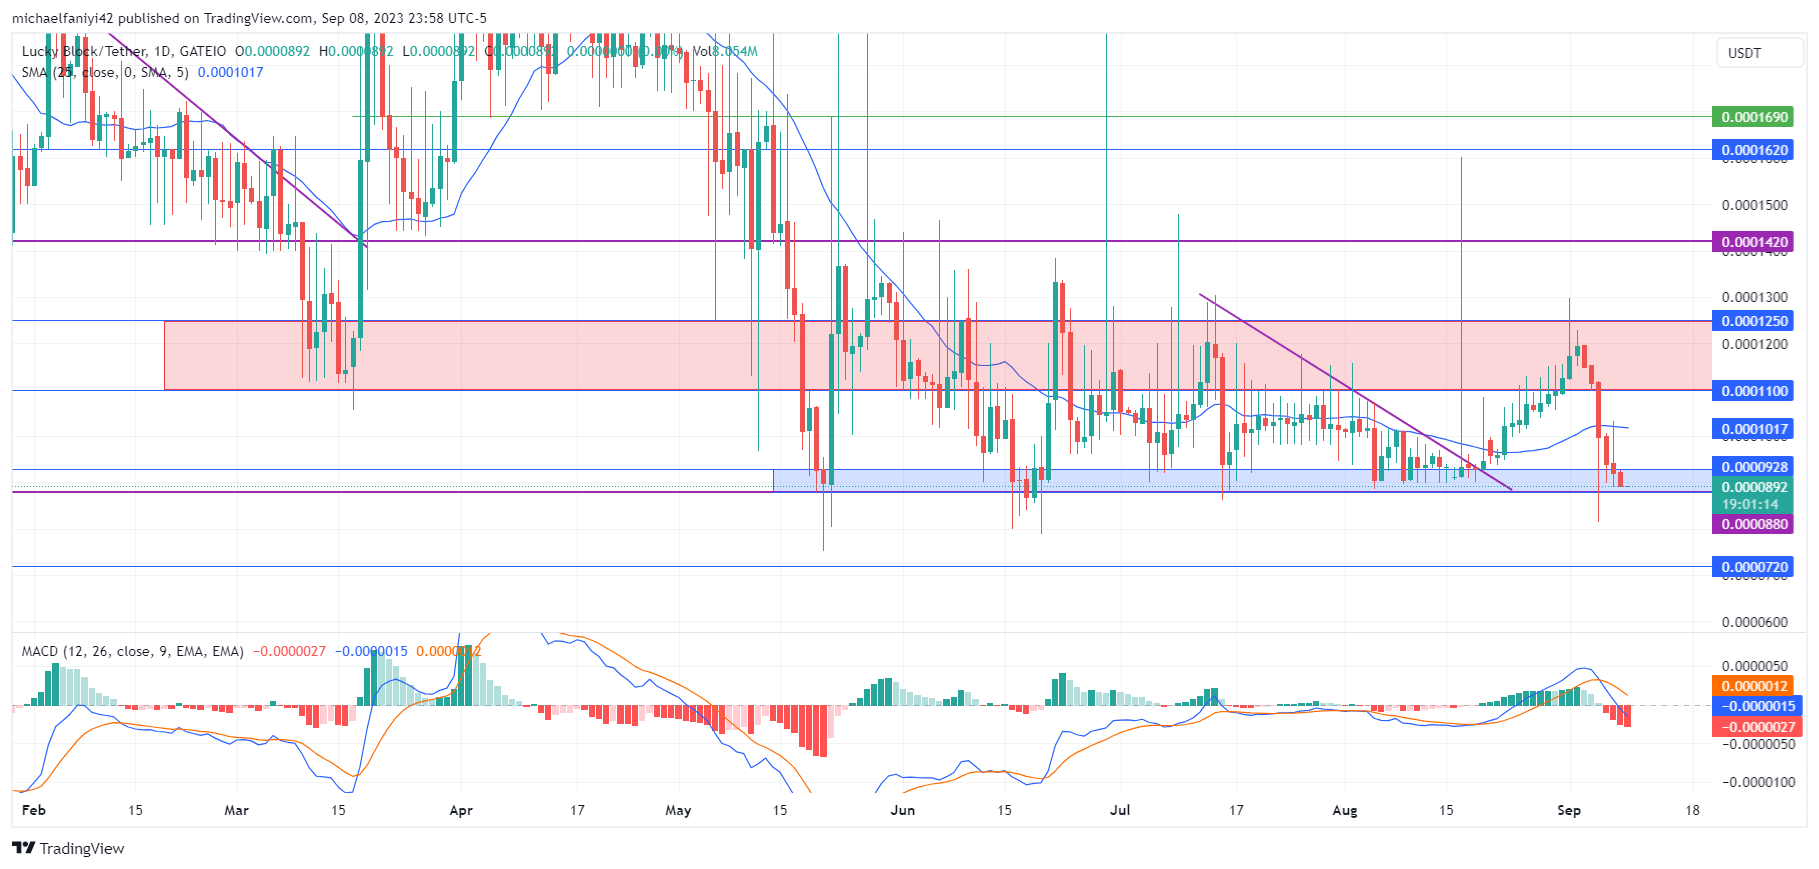
LBLOCK is set to rebuild another rally from the $0.0000880 significant demand level. The market has been quite resilient and has gotten back up every time it has been rejected. Moreover, the $0.0000880 demand level has been an anchor level for the market since its inception, and prices have hardly dropped below that level ever since. With these components, the coin is certain to rally again and reward investors at this level handsomely.
Lucky Block Price Forecast – Expert Analysis & Trading Tips | Learn 2 Trade – Expert Analysis & Trading Tips | Learn 2 Trade: LBLOCK/USD Outlook
LBLOCK is poised to initiate a new rally, leveraging the significant demand level at $0.0000880. The market has exhibited remarkable resilience, consistently rebounding after each rejection.
Notably, the $0.0000880 demand level has maintained its role as a steadfast anchor since the coin’s inception, with prices rarely dipping below this threshold.
This confluence of factors suggests a promising outlook for investors, with the coin expected to deliver substantial rewards at this level.
LBLOCK/USD Medium-Term Trend: Bullish (4-hour chart)
Examining the technical indicators, during the initial consolidation within a triangle pattern leading to the subsequent price breakout and subsequent dip, the 25-period Moving Average (MA) has oscillated both above and below the candlesticks. Presently, it is positioned above them. Additionally, the Moving Average Convergence Divergence (MACD) has depicted substantial bearish histogram bars, with its line on the brink of crossing below the zero level.

On the 4-hour chart, the 25-period MA remains distinctly above the candlesticks, while the MACD lines have descended significantly into negative territory. However, a slight uptick in the lines hints at the gradual resurgence of bullish activity, coinciding with the coin’s interaction with the $0.0000880 demand level.
How To Buy Lucky Block
Note: Learn2.trade is not a financial advisor. Do your research before investing your funds in any financial asset or presented product or event. We are not responsible for your investing results.


