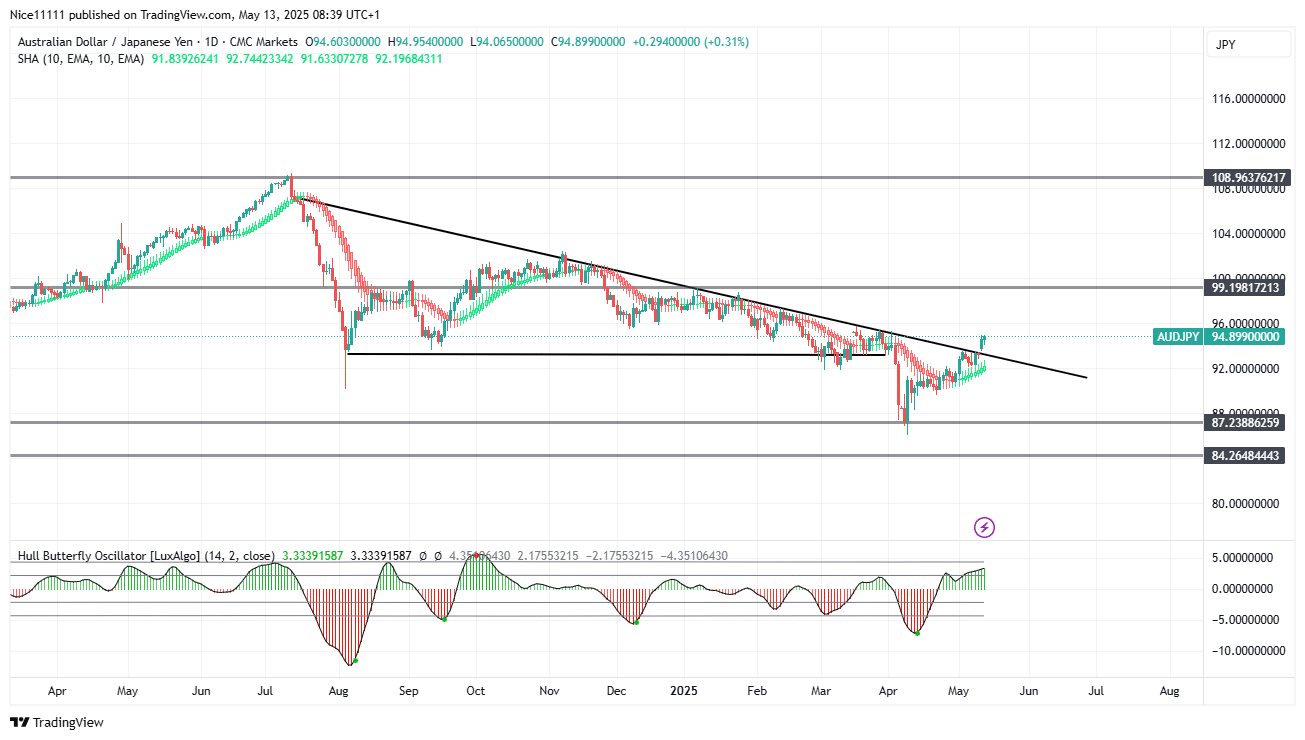
The AUDJPY pair has been influenced by a well-defined resistance trendline on the daily chart, which previously guided its bearish momentum. However, a decisive price reversal at the 87.240 support level has triggered a bullish ascent, ultimately leading to a breakout above the resistance trendline, signalling a potential shift in market sentiment.
AUDJPY Key Levels
Demand Levels: 93.000 87.240, 84.260
Supply Levels: 99.200, 108.960, 110.000
AUDJPY Long-Term Trend: Bullish
A descending resistance trendline has capped AUDJPY since November 2023, showing sustained selling pressure. The pair plunged sharply in April 2024, breaking the 93.00 support. When prices hit the 87.240 demand zone, the Hull Butterfly Oscillator signaled oversold conditions, triggering a strong bullish reversal.
.
The oscillator now shows powerful bullish momentum, supporting the current uptrend. Green Smoothed Heikin Ashi candles confirm this buying pressure. The price gapped above resistance, demonstrating bullish strength and suggesting further upside potential.
AUDJPY Short-Term Trend: Bullish
In the near term, the price is expected to target previous swing highs, which represent key liquidity zones due to the accumulation of large pending orders. With the breakout confirmation and the shift in market structure, the AUDJPY trend has now turned bullish, presenting potential buying opportunities as the pair aims for higher resistance levels.
.
The break of the resistance trendline, supported by bullish technical indicators, suggests a strengthening upward momentum. Traders should monitor follow-through buying above the trendline and watch for potential retests of the breakout level as confirmation of continued bullish dominance.
Trade on MT4 with Leverage up to 1:500! Trade on MT4 with Leverage up to 1:500!
X
We use cookies to ensure that we give you the best experience on our website. If you continue to use this site we will assume that you are happy with it.

 AUDJPY Short-Term Trend: Bullish


