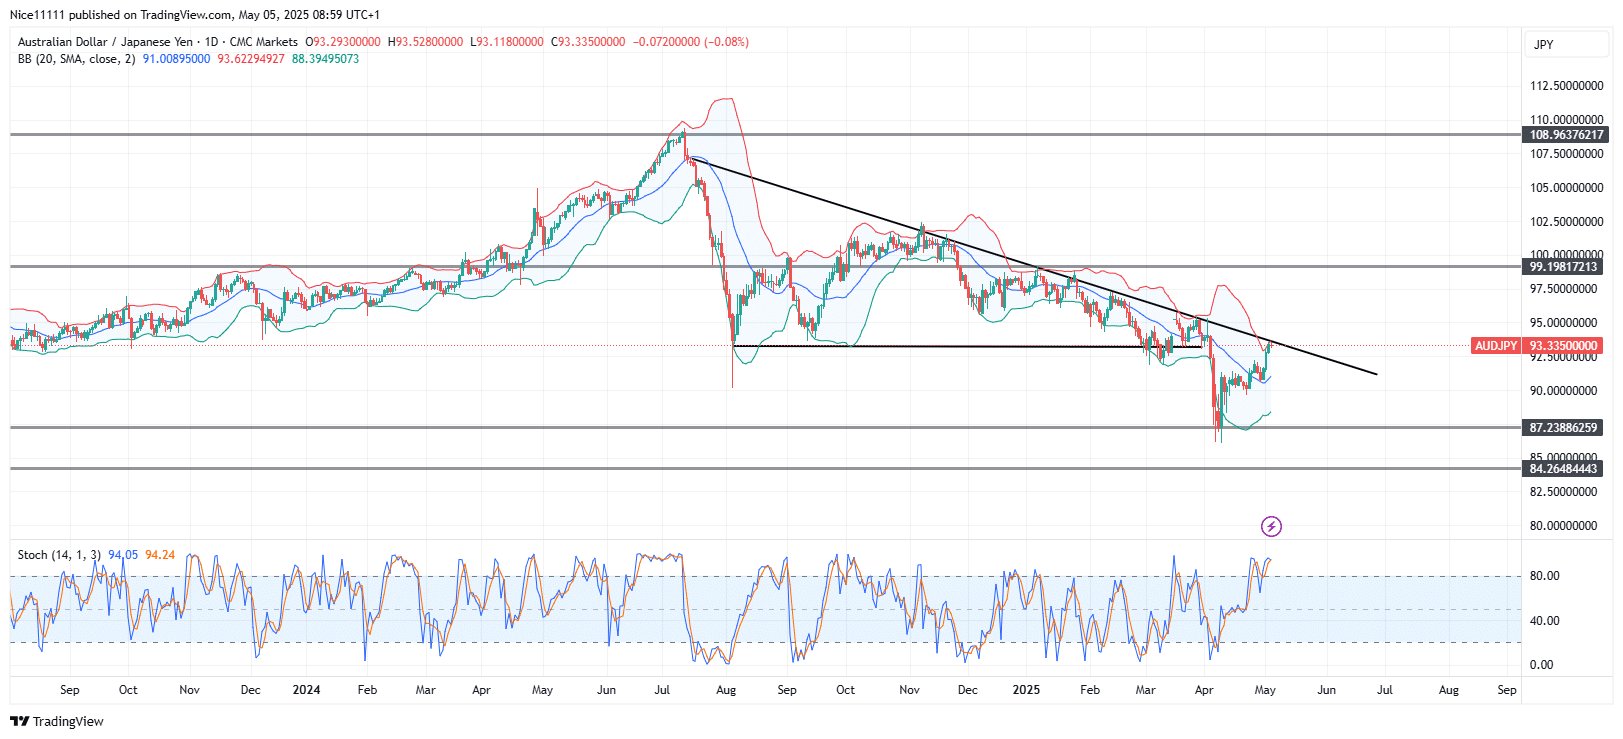
AUDJPY broke out of a descending triangle on the daily charts. Price now retraces toward the broken descending triangle. The pullback tests the former descending trendline of the triangle as a potential resistance.
AUDJPY Key Levels
Demand Levels: 90.00, 87.40, 83.90
Supply Levels: 95.30, 98.30, 101.40
AUDJPY Long-Term Trend: Bearish
Sellers pushed AUDJPY lower, forming lower highs. Buyers failed to break 93.50 support multiple times. The breakdown below 93.50 triggered sharp declines. The price fell to 87.240, where buying emerged. The Stochastic hit oversold levels at 87.240. This prompted short covering and bargain hunting. However, the broader trend remains bearish.
.
The price has once again reached the upper Bollinger Band while simultaneously testing the descending resistance trendline, creating a clear technical confluence. This repeated interaction with the dual resistance zone shows the market is respecting these levels, with each previous test resulting in pullbacks. The current retest presents a critical juncture where traders will watch for either a rejection confirming the downtrend’s strength or a breakout that could signal shifting momentum. The reaction here will be telling for the near-term direction.
AUDJPY Short-Term Trend: Bearish
Lower timeframes show temporary bullish momentum. This is just a counter-trend bounce. The descending trendline is expected to cap gains. Traders may watch for rejection patterns here. A bearish structural shift would signal a downtrend resumption.
Trade on MT4 with Leverage up to 1:500! Trade on MT4 with Leverage up to 1:500!
X
We use cookies to ensure that we give you the best experience on our website. If you continue to use this site we will assume that you are happy with it.

 AUDJPY Short-Term Trend: Bearish
 AUDJPY Short-Term Trend: Bearish


