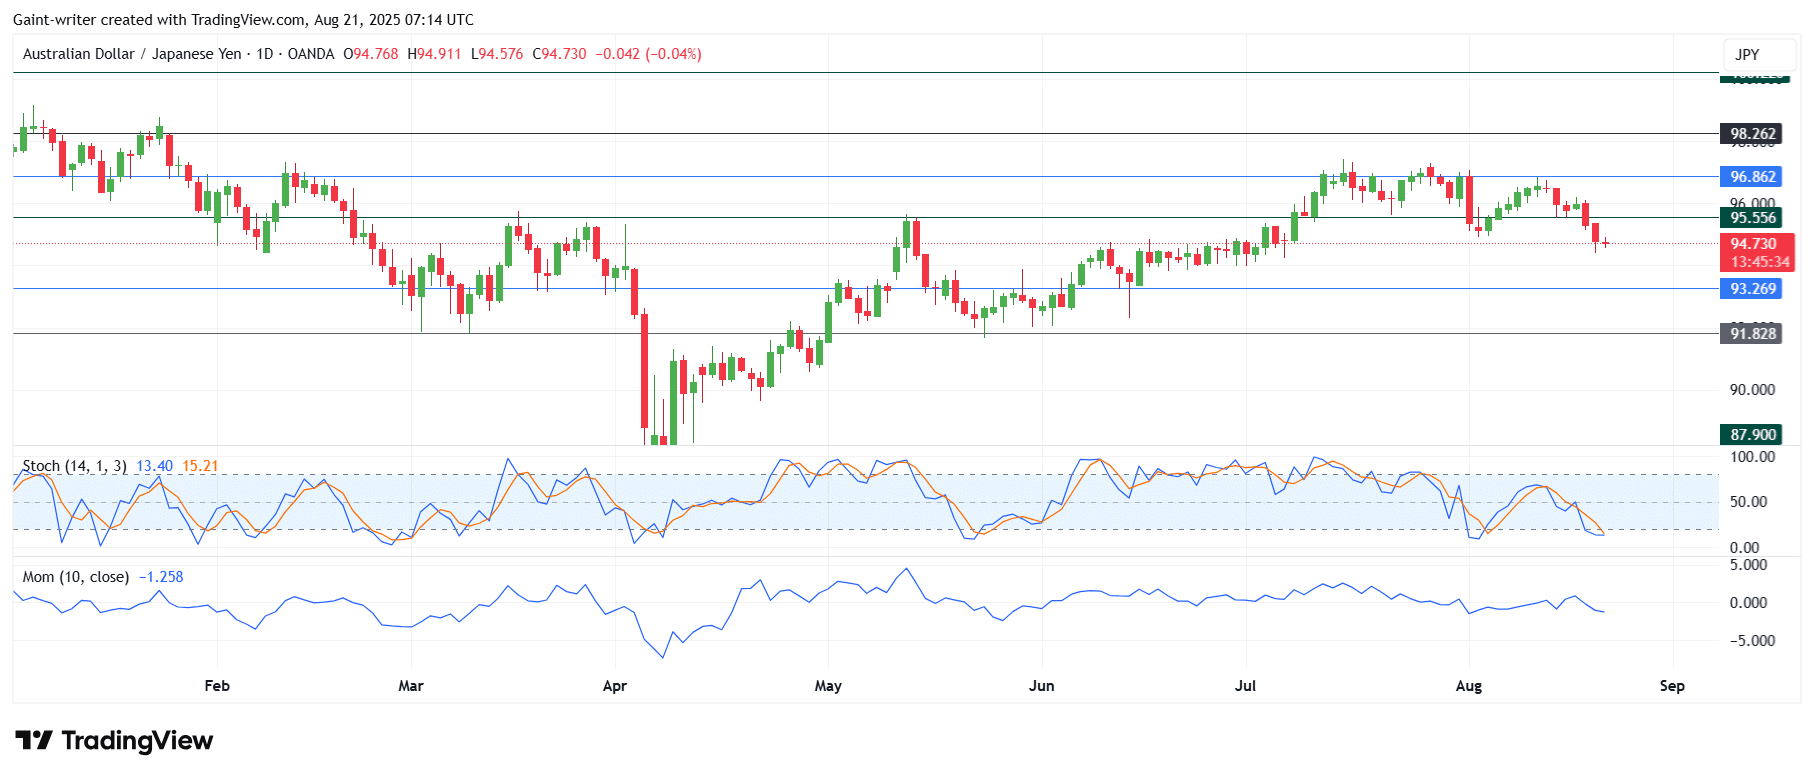
AUDJPY is decidedly bearish as sellers remain firmly in command following a significant failure at a key multi-month resistance level. This rejection has catalyzed a strong downtrend that, while still intact, is now showing signs of temporary exhaustion. It has led to a consolidation phase at the recent lows as the market digests its rapid descent
AUDJPY Key Levels
Support Levels: 93.20, 91.80
Resistance Levels: 95.50, 96.80
AUDJPY Long-Term Trend: Bearish
AUDJPY formed a bearish “double top” pattern after failing to break above the formidable 96.86 resistance zone in late July and again in mid-August. This powerful reversal pattern triggered an aggressive sell-off, confirmed by a series of large, consecutive bearish candles that erased several weeks of gains.
.
Currently trading at 94.73, the price has paused its decline. The most recent daily candle is a small-bodied “spinning top,” which indicates indecision. After a sustained sell-off, this type of candle suggests that sellers may be taking profits or pausing their attack, potentially allowing for a brief period of sideways action or a minor bounce. The Momentum indicator, with a strong negative reading of -1.256, confirms the formidable power behind the current downtrend.
AUDJPY Short-Term Trend: Bearish
The short-term indicators are signaling a potential for a minor counter-trend bounce. While the price has been flat, the Stochastic Oscillator has executed a bullish crossover from the oversold region and is pointing upwards. The Momentum indicator, though still negative at -0.357, has also begun to hook upwards from its lows. This bullish divergence between price and the oscillators suggests that the immediate downward pressure is fading.
Trade on MT4 with Leverage up to 1:500! Trade on MT4 with Leverage up to 1:500!
X
We use cookies to ensure that we give you the best experience on our website. If you continue to use this site we will assume that you are happy with it.

 AUDJPY Short-Term Trend: Bearish
 AUDJPY Short-Term Trend: Bearish


