Key Resistance Levels: 78.00, 80.00, 82.00
Key Support Levels: 58.00, 60.00, 62.00
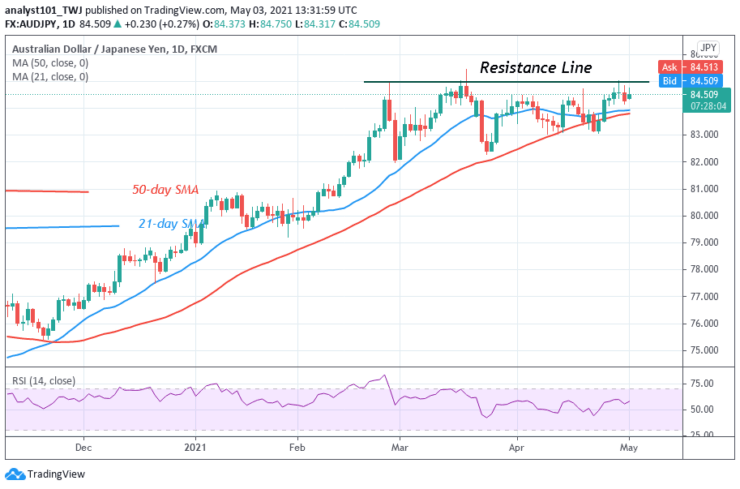
AUD/JPY Price Long-term Trend: Ranging
The pair has continued its sideways trend since February 24. It has been fluctuating between levels 83.00 and 85.00. The upward move will resume if price breaks above level 85.00 high. Today, the currency pair is retracing from the high of level 84.75. The pair has reached the low of level 84.48 and may further decline.
Daily Chart Indicators Reading:
AUD/JPY pair is at level 57 of the Relative Strength Index period 14. It indicates that the market is in the bullish trend zone. The 21-day SMA and the 50-day SMA are sloping horizontally indicating the sideways trend.
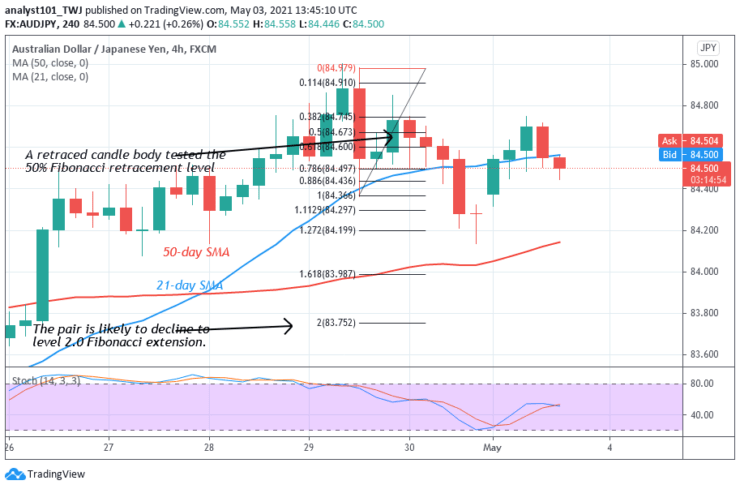
AUD/JPY Medium-term Trend: Bearish
On the 4-hour chart, AUD/JPY pair is falling on the downside. Meanwhile, on April 27 downtrend; the retraced candle body tested the 50% Fibonacci retracement level. This retracement indicates that the market will fall to level 2.0 Fibonacci extension or the low of level 83.75.
4-hour Chart Indicators Reading
The AUD/JPY pair is below the 60% range of the daily stochastic. It indicates that the pair is in a bearish momentum. The SMAs are sloping horizontally indicating the sideways move.
General Outlook for AUD/JPY
AUD/JPY pair has been in a sideways trend for the past two months. The pair is retracing now for a possible upward move. The Fibonacci tool has indicated a possible downward move to level 83.75.
You can purchase crypto coins here: Buy Coins
Note: Learn2.Trade is not a financial advisor. Do your research before investing your funds in any financial asset or presented product or event. We are not responsible for your investing results
- Broker
- Min Deposit
- Score
- Visit Broker

- Award-winning Cryptocurrency trading platform
- $100 minimum deposit,
- FCA & Cysec regulated

- 20% welcome bonus of upto $10,000
- Minimum deposit $100
- Verify your account before the bonus is credited
- Fund Moneta Markets account with a minimum of $250
- Opt in using the form to claim your 50% deposit bonus
Learn to Trade
Never Miss A Trade Again

Signal Notification
Real-time signal notifications whenever a signal is opened, closes or Updated

Get Alerts
Immediate alerts to your email and mobile phone.

Entry Price Levels
Entry price level for every signal Just choose one of our Top Brokers in the list above to get all this free.