
Key Resistance Levels: 78.00, 80.00, 82.00
Key Support Levels: 58.00, 60.00, 62.00
AUD/JPY Price Long-term Trend: Ranging
For the past month, AUD/JPY pair has been trading below level 84.50 resistance. The bulls have not been able to break the resistance at levels 84.50 and 85.00. On April 20, the bulls broke the resistance at 84.50 but could not sustain the bullish momentum.
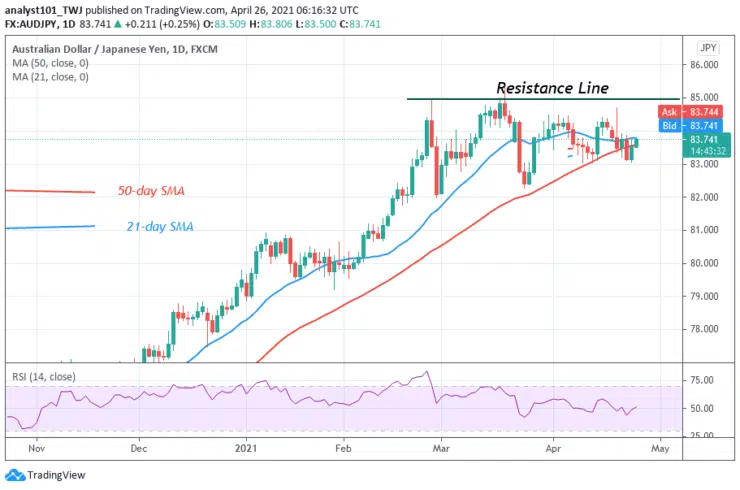
Daily Chart Indicators Reading:
AUD/JPY pair has fallen to level 51 of the Relative Strength Index period 14. It indicates that there is a balance between supply and demand. The 21-day SMA and the 50-day SMA are sloping horizontally indicating the sideways trend.
AUD/JPY Medium-term Trend: Ranging
On the 4-hour chart, AUD/JPY fell to the low of level 83.26 and corrected upward. The upward correction was terminated as price fell to retest level 83.26. The market has risen again as the pair faces rejection at the recent high. Meanwhile, on April 21 downtrend; the retraced candle body tested the 61.8% Fibonacci retracement level. This retracement indicates that the market will fall to level 1.618 Fibonacci extension or the low of level 82.32.


