
Key Resistance Levels: 78.00, 80.00, 82.00
Key Support Levels: 58.00, 60.00, 62.00
AUD/JPY Price Long-term Trend: Bullish
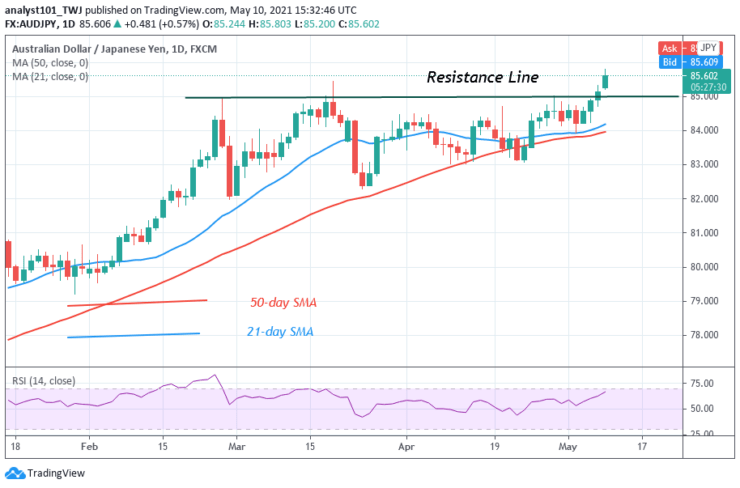
On May 7, Buyers broke the resistance level at 85.00 which has been holding since February. As price closed above the resistance level, it is assumed that the uptrend has begun. In the previous action, the pair was fluctuating between levels 83.00 and 85.00. The market is expected to further rise to level 87.00.
Daily Chart Indicators Reading:
AUD/JPY pair is at level 65 of the Relative Strength Index period 14. It indicates that the market is in the bullish trend zone. The 21-day SMA and the 50-day SMA are sloping upward indicating the uptrend.
AUD/JPY Medium-term Trend: Bullish
On the 4-hour chart, AUD/JPY pair is in a strong uptrend. The pair has broken the previous resistance level at level 85.00. On April 29 uptrend; a retraced candle body tested the 61.8% Fibonacci retracement level. The retracement indicates that the pair is likely to rise to level 1.618 Fibonacci extension or level 86.18.


